Berkshire Hathaway 2006 Annual Report Download - page 5
Download and view the complete annual report
Please find page 5 of the 2006 Berkshire Hathaway annual report below. You can navigate through the pages in the report by either clicking on the pages listed below, or by using the keyword search tool below to find specific information within the annual report.-
 1
1 -
 2
2 -
 3
3 -
 4
4 -
 5
5 -
 6
6 -
 7
7 -
 8
8 -
 9
9 -
 10
10 -
 11
11 -
 12
12 -
 13
13 -
 14
14 -
 15
15 -
 16
16 -
17
-
18
-
19
-
20
-
21
-
22
-
23
-
24
-
25
-
26
-
27
-
28
-
29
-
30
-
31
-
32
-
33
-
34
-
35
-
36
-
37
-
38
-
39
-
40
-
41
-
42
-
43
-
44
-
45
-
46
-
47
-
48
-
49
-
50
-
51
-
52
-
53
-
54
-
55
-
56
-
57
-
58
-
59
-
60
-
61
-
62
-
63
-
64
-
65
-
66
-
67
-
68
-
69
-
70
-
71
-
72
-
73
-
74
-
75
-
76
-
77
-
78
-
79
-
80
-
81
-
82
 |
 |

In fairness, we’ ve seen plenty of successes as well, some truly outstanding. There are many giant-
company managers whom I greatly admire; Ken Chenault of American Express, Jeff Immelt of G.E. and
Dick Kovacevich of Wells Fargo come quickly to mind. But I don’ t think I could do the management job
they do. And I know I wouldn’ t enjoy many of the duties that come with their positions – meetings,
speeches, foreign travel, the charity circuit and governmental relations. For me, Ronald Reagan had it
right: “It’ s probably true that hard work never killed anyone – but why take the chance?”
So I’ ve taken the easy route, just sitting back and working through great managers who run their
own shows. My only tasks are to cheer them on, sculpt and harden our corporate culture, and make major
capital-allocation decisions. Our managers have returned this trust by working hard and effectively.
For their performance over the last 42 years – and particularly for 2006 – Charlie and I thank
them.
Yardsticks
Charlie and I measure Berkshire’ s progress and evaluate its intrinsic value in a number of ways.
No single criterion is effective in doing these jobs, and even an avalanche of statistics will not capture some
factors that are important. For example, it’ s essential that we have managers much younger than I available
to succeed me. Berkshire has never been in better shape in this regard – but I can’ t prove it to you with
numbers.
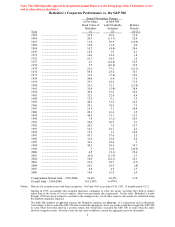
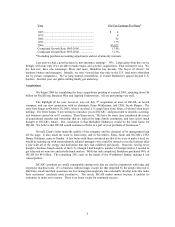
There are two statistics, however, that are of real importance. The first is the amount of
investments (including cash and cash-equivalents) that we own on a per-share basis. Arriving at this figure,
we exclude investments held in our finance operation because these are largely offset by borrowings.
Here’ s the record since present management acquired control of Berkshire:
Year
Per-Share Investments*
1965 ..................................................................... $ 4
1975 ..................................................................... 159
1985 ..................................................................... 2,407
1995 ..................................................................... 21,817
2006 ..................................................................... $80,636
Compound Growth Rate 1965-2006.................... 27.5%
Compound Growth Rate 1995-2006.................... 12.6%
*Net of minority interests
In our early years we put most of our retained earnings and insurance float into investments in
marketable securities. Because of this emphasis, and because the securities we purchased generally did
well, our growth rate in investments was for a long time quite high.
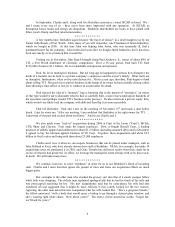
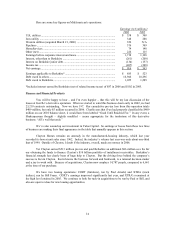
Over the years, however, we have focused more and more on the acquisition of operating
businesses. Using our funds for these purchases has both slowed our growth in investments and accelerated
our gains in pre-tax earnings from non-insurance businesses, the second yardstick we use. Here’ s how
those earnings have looked:
4