Berkshire Hathaway 2006 Annual Report Download - page 40
Download and view the complete annual report
Please find page 40 of the 2006 Berkshire Hathaway annual report below. You can navigate through the pages in the report by either clicking on the pages listed below, or by using the keyword search tool below to find specific information within the annual report.-
 1
1 -
2
-
3
-
4
-
5
-
6
-
7
-
8
-
9
-
10
-
11
-
12
-
13
-
14
-
15
-
16
-
17
-
18
-
19
-
20
-
21
-
22
-
23
-
24
-
25
-
26
-
27
-
28
-
29
-
 30
30 -
 31
31 -
 32
32 -
 33
33 -
 34
34 -
 35
35 -
 36
36 -
 37
37 -
 38
38 -
 39
39 -
 40
40 -
 41
41 -
 42
42 -
 43
43 -
 44
44 -
 45
45 -
 46
46 -
 47
47 -
 48
48 -
 49
49 -
 50
50 -
51
-
52
-
53
-
54
-
55
-
56
-
57
-
58
-
59
-
60
-
61
-
62
-
63
-
64
-
65
-
66
-
67
-
68
-
69
-
70
-
71
-
72
-
73
-
74
-
75
-
76
-
77
-
78
-
79
-
80
-
81
-
82
 |
 |

39
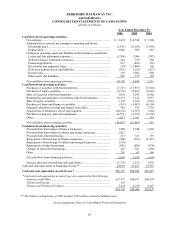
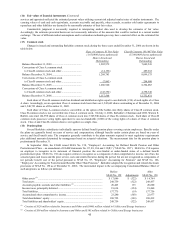
(7) Investment gains (losses)
Investment gains (losses) are summarized below (in millions).
2006 2005 2004
Fixed maturity securities —
Gross gains from sales and other disposals ........................................................... $ 279 $ 792 $ 883
Gross losses from sales and other disposals.......................................................... (9) (23) (63)
Equity securities —
Gross gains from sales and other disposals
(
1
)
....................................................... 1,562 5,612 769
Gross losses from sales.......................................................................................... (44) (6) (1)
Losses from other-than-temporary impairments ....................................................... (142) (114) (19)
Life settlement contracts
(
2
)
....................................................................................... 92 (82) (207)
Other investments...................................................................................................... 73 17 274
$1,811 $6,196 $1,636
Net gains (losses) are reflected in the Consolidated Statements of Earnings as follows.
Insurance and other ................................................................................................... $1,697 $5,728 $1,746
Finance and financial products.................................................................................. 114 468 (110)
$1,811 $6,196 $1,636
(1) Gross gains from sales and other disposals of equity securities during 2005 includes a $5.0 billion gain on the exchange of The Gillette
Company common shares for common shares of The Procter and Gamble Company.
(2) The FASB issued Staff Position No. FTB 85-4-1, “Accounting for Life Settlement Contracts by Third-Party Investors” (“FTB 85-4-1”) in
2006, which provides guidance on the initial and subsequent measurement, financial statement presentation and disclosures for third-party investors
in life settlement contracts. Berkshire adopted FTB 85-4-1 as of January 1, 2006, and recorded an after-tax gain of $180 million which is reflected as
an increase in retained earnings. Berkshire elected to use the investment method whereby the initial transaction price plus all subsequent direct
external costs paid to keep the policy in force are capitalized. Death benefits received are applied against the capitalized costs and the difference is
recorded in earnings. Previously, life settlement contracts were valued at the cash surrender value of the underlying insurance policy. During the
second quarter of 2006, certain life settlement contracts were disposed of for proceeds of approximately $330 million. Investments in life settlement
contracts as of December 31, 2006 were insignificant.
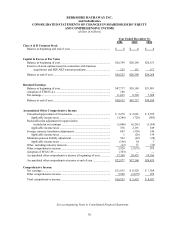
(8) Goodwill
A reconciliation of the change in the carrying value of goodwill for 2006 and 2005 is as follows (in millions).
2006 2005
Balance at beginning of year ..................................................................................... $23,644 $23,012
Goodwill related to MidAmerican as of January 1, 2006 .......................................... 4,156 —
Acquisitions of businesses and other......................................................................... 4,438 632
Balance at end of year ............................................................................................... $32,238 $23,644
The MidAmerican goodwill represents the consolidation of Berkshire’ s investment in MidAmerican as of January 1, 2006. The
increase in goodwill from business acquisitions and other primarily relates to the acquisitions of PacifiCorp and IMC.
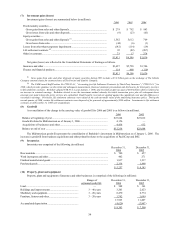
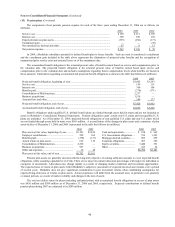
(9) Inventories
Inventories are comprised of the following (in millions):
December 31, December 31,
2006 2005
Raw materials...................................................................................................................... $ 700 $ 657
Work in progress and other................................................................................................. 402 271
Finished manufactured goods ............................................................................................. 1,817 1,217
Purchased goods.................................................................................................................. 2,338 1,998
$ 5,257 $ 4,143
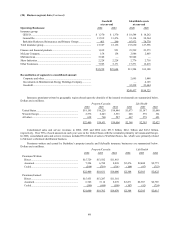
(10) Property, plant and equipment
Property, plant and equipment of insurance and other businesses is comprised of the following (in millions):
Ranges of December 31, December 31,
estimated useful life 2006 2005
Land..................................................................................... — $ 548 $ 361
Buildings and improvements .............................................. 3 – 40 years 3,203 2,623
Machinery and equipment................................................... 3 – 20 years 8,470 6,774
Furniture, fixtures and other................................................ 3 – 20 years 1,702 1,649
13,923 11,407
Accumulated depreciation .................................................. (4,620) (3,907)
$ 9,303 $ 7,500