Berkshire Hathaway 2005 Annual Report Download - page 13
Download and view the complete annual report
Please find page 13 of the 2005 Berkshire Hathaway annual report below. You can navigate through the pages in the report by either clicking on the pages listed below, or by using the keyword search tool below to find specific information within the annual report.-
 1
1 -
2
-
 3
3 -
 4
4 -
 5
5 -
 6
6 -
 7
7 -
 8
8 -
 9
9 -
 10
10 -
 11
11 -
 12
12 -
 13
13 -
 14
14 -
 15
15 -
 16
16 -
 17
17 -
 18
18 -
 19
19 -
 20
20 -
 21
21 -
 22
22 -
 23
23 -
24
-
25
-
26
-
27
-
28
-
29
-
30
-
31
-
32
-
33
-
34
-
35
-
36
-
37
-
38
-
39
-
40
-
41
-
42
-
43
-
44
-
45
-
46
-
47
-
48
-
49
-
50
-
51
-
52
-
53
-
54
-
55
-
56
-
57
-
58
-
59
-
60
-
61
-
62
-
63
-
64
-
65
-
66
-
67
-
68
-
69
-
70
-
71
-
72
-
73
-
74
-
75
-
76
-
77
-
78
-
79
-
80
-
81
-
82
 |
 |

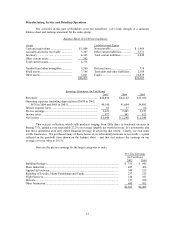
Manufacturing, Service and Retailing Operations
Our activities in this part of Berkshire cover the waterfront. Let’ s look, though, at a summary
balance sheet and earnings statement for the entire group.
Balance Sheet 12/31/05 (in $ millions)
Assets Liabilities and Equity
Cash and equivalents .............................. $ 1,004 Notes payable ............................ $ 1,469
Accounts and notes receivable ............... 3,287 Other current liabilities.............. 5,371
Inventory ................................................ 4,143 Total current liabilities .............. 6,840
Other current assets ................................ 342
Total current assets................................. 8,776
Goodwill and other intangibles............... 9,260 Deferred taxes............................ 338
Fixed assets............................................. 7,148 Term debt and other liabilities... 2,188
Other assets............................................. 1,021 Equity ........................................ 16,839
$26,205 $26,205
Earnings Statement (in $ millions)
2005 2004 2003
Revenues .................................................................................... $46,896 $44,142 $32,106
Operating expenses (including depreciation of $699 in 2005,
$676 in 2004 and $605 in 2003).......................................... 44,190 41,604 29,885
Interest expense (net).................................................................. 83 57 64
Pre-tax earnings.......................................................................... 2,623 2,481 2,157
Income taxes............................................................................... 977 941 813
Net income ................................................................................. $ 1,646 $ 1,540 $ 1,344
This eclectic collection, which sells products ranging from Dilly Bars to fractional interests in
Boeing 737s, earned a very respectable 22.2% on average tangible net worth last year. It’ s noteworthy also
that these operations used only minor financial leverage in achieving that return. Clearly, we own some
terrific businesses. We purchased many of them, however, at substantial premiums to net worth – a point
reflected in the goodwill item shown on the balance sheet – and that fact reduces the earnings on our
average carrying value to 10.1%.
Here are the pre-tax earnings for the larger categories or units.
Pre-Tax Earnings
(in $ millions)
2005 2004
Building Products .................................................................................................... $ 751 $ 643
Shaw Industries ....................................................................................................... 485 466
Apparel & Footwear................................................................................................ 348 325
Retailing of Jewelry, Home Furnishings and Candy ............................................... 257 215
Flight Services......................................................................................................... 120 191
McLane.................................................................................................................... 217 228
Other businesses ...................................................................................................... 445 413
$2,623 $2,481
12