Barnes and Noble 1997 Annual Report Download - page 5
Download and view the complete annual report
Please find page 5 of the 1997 Barnes and Noble annual report below. You can navigate through the pages in the report by either clicking on the pages listed below, or by using the keyword search tool below to find specific information within the annual report.-
 1
1 -
 2
2 -
 3
3 -
 4
4 -
 5
5 -
 6
6 -
 7
7 -
 8
8 -
 9
9 -
 10
10 -
 11
11 -
 12
12 -
 13
13 -
 14
14 -
 15
15 -
 16
16 -
17
-
18
-
19
-
20
-
21
-
22
-
23
-
24
-
25
-
26
-
27
-
28
-
29
-
30
-
31
-
32
-
33
-
34
-
35
-
36
-
37
-
38
-
39
-
40
-
41
-
42
 |
 |

1
BARNES
&
NOBLE
1997
FINANCIAL HIGHLIGHTS
FISCAL YEAR Jan. 31
,
1998 Feb. 1, 1997
(1)
Jan. 27, 1996
(Dollars in Millions, except Per Share data)
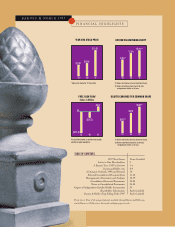
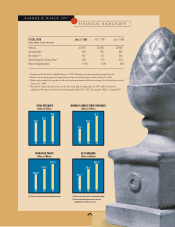
Revenues $2,796.9 $2,448.1 $1,976.9
Operating Profit
(2)
147.3 119.7 88.6
Net Earnings
(2)(3)
64.7 51.2 34.3
Diluted Earnings Per Common Share
(4)
0.93 0.75 0.53
Return On Beginning Equity 14.2% 12.8% 9.6%
(1)
Represents the 53 weeks ended February 1, 1997. All other years presented represent 52 weeks.
(2)
Before restructuring and asset impairment charge for the fiscal year ended January 27, 1996.
(3)
Before extraordinary charge due to the early extinguishment of debt, net of taxes, for the fiscal year ended
January 31, 1998.
(4)
Restated to reflect the effect of a two-for-one stock split on September 22, 1997 and to reflect the
adoption of Statement of Financial Accounting Standards No. 128, “Earnings Per Share,” during 1997.
TOTAL REVENUES
Dollars in Billions
$2.0 $2.4
$2.8
’95 ’96 ’97
OPERATING PROFIT
Dollars in Millions
$88.6(1)
$119.7
$147.3
’95 ’96 ’97
(1) Before restructuring and asset impairment charge.
NET EARNINGS
Dollars in Millions
$34.3(1)
$51.2
$64.7(2)
’95 ’96 ’97
(1) Before restructuring and asset impairment charge.
(2) Before extraordinary charge due to the early
extinguishment of debt, net of taxes.
$1.3
$1.9
$2.2
’95 ’96 ’97
BARNES & NOBLE STORE REVENUES
Dollars in Billions