Barnes and Noble 1997 Annual Report Download - page 10
Download and view the complete annual report
Please find page 10 of the 1997 Barnes and Noble annual report below. You can navigate through the pages in the report by either clicking on the pages listed below, or by using the keyword search tool below to find specific information within the annual report.-
 1
1 -
 2
2 -
 3
3 -
 4
4 -
 5
5 -
 6
6 -
 7
7 -
 8
8 -
 9
9 -
 10
10 -
 11
11 -
 12
12 -
 13
13 -
 14
14 -
 15
15 -
 16
16 -
 17
17 -
 18
18 -
 19
19 -
 20
20 -
 21
21 -
22
-
23
-
24
-
25
-
26
-
27
-
28
-
29
-
30
-
31
-
32
-
33
-
34
-
35
-
36
-
37
-
38
-
39
-
40
-
41
-
42
 |
 |

handling, freight, scheduling and
inventory costs down. We added
five times the capacity of our previ-
ous distribution network, thereby
broadening title selection and provid-
ing just-in-time inventory delivery to
our stores. A strategic benefit of the
distribution center is that its nearly
600,000 titles supply about 90%
of the books purchased through
BarnesandNoble.com,
an important competitive
advantage in the e-commerce
arena. Second, operating
profit improvement is also
attributable to the contin-
ued leveraging of fixed
costs such as selling, general and
administrative, rent and pre-opening
expenses.This leveraging was the
result of the maturation of the
Barnes & Noble stores from 2.3
years in 1996 to 2.8 years in 1997.
Continuing maturation will generate
further margin expansion as the
stores grow to an average age of
3.3 years by the end of 1998.
We easily absorbed the $15.4
million operating loss associated with
the start-up of BarnesandNoble.com
and have generated 23 consecutive
quarters of operating profit increases.
The operating profit without
BarnesandNoble.com would
have been $162.7 million, resulting
in an operating margin of 5.8%.
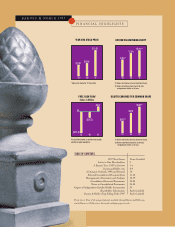
Positive Cash Flows
We generated $47.3 million of free
cash flow. 1997 marked the first
year in which strong cash flows
from operating activities exceeded
capital expenditures since the
“super” store rollout began. This
was due in part to the strong
emphasis on inventory management
facilitated by our new merchandise
replenishment systems. Because of
record growth, expanded gross
margins, improved operating
leverage and positive cash flows,
we were able to refinance our
$190 million, 117
⁄8% subordinated
debt with senior debt. In recognition
of Barnes& Noble’s strong financial
performance, this refinancing was
completed at significantly lower
spreads and will substantially
decrease annual interest expense.
One of the key indicators of financial
leverage—average debt to earnings
before interest, taxes, depreciation
and amortization (EBITDA)—
reduced from 1.98 times to 1.56
times, evidencing our strong cash
flow and moderating leverage.
EBITDA increased 25%
for the fiscal year to $224 million,
resulting in an EBITDA margin
of 8.0%, the highest we have ever
recorded. 1997 represents the
fourth consecutive year of at least
25% growth in EBITDA.
Net Earnings
Consolidated net earnings,before the
$11.5 million charge associated with
the note redemption, increased 26%
to $64.7 million. Adjusting for both
the net loss of $9.1 million for
BarnesandNoble.com’s first year of
operation and the $11.5 million
note redemption charge, the consol-
idated net earnings would have
been $73.8 million, the highest in
our history. After these
adjustments, consol-
idated EPS increased
24% to $0.93, driving
the value of the
company’s shares to an
all-time high.
Shareholder Returns
In September 1997, Barnes &
Noble stock split. A purchase of 100
shares for $2,000.00 at the initial
public offering in 1993 would have
grown to 200 shares worth more
than $6,350.00 by the end of fiscal
1997. This reflected a compound
annual return of over 30%.
6
A BANNER YEAR CONTINUED
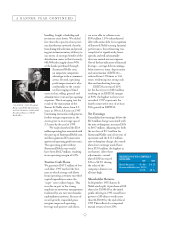
TOP:
DAVID K. CULLY President,
Barnes and Noble Distribution
BOTTOM:
THOMAS A.TOLWORTHY
President, Barnes & Noble
Booksellers
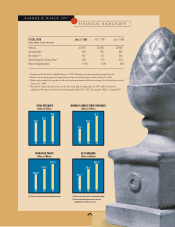
CONSOLIDATED EPS OF $0.93 IS COMPRISED OF
THE FOLLOWING: 1997 1996
Retail Business $ 1.06 $ 0.75
BarnesandNoble.com (0.13) –
$ 0.93 $0.75