Barnes and Noble 1997 Annual Report Download - page 15
Download and view the complete annual report
Please find page 15 of the 1997 Barnes and Noble annual report below. You can navigate through the pages in the report by either clicking on the pages listed below, or by using the keyword search tool below to find specific information within the annual report.-
 1
1 -
2
-
3
-
4
-
 5
5 -
 6
6 -
 7
7 -
 8
8 -
 9
9 -
 10
10 -
 11
11 -
 12
12 -
 13
13 -
 14
14 -
 15
15 -
 16
16 -
 17
17 -
 18
18 -
 19
19 -
 20
20 -
 21
21 -
 22
22 -
 23
23 -
 24
24 -
 25
25 -
26
-
27
-
28
-
29
-
30
-
31
-
32
-
33
-
34
-
35
-
36
-
37
-
38
-
39
-
40
-
41
-
42
 |
 |

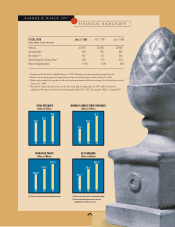
SELECTED CONSOLIDATED FINANCIAL DATA
The selected consolidated financial data of Barnes & Noble, Inc. and its wholly owned subsidiaries (collectively, the Company) set forth
on the following pages should be read in conjunction with the consolidated financial statements and notes included elsewhere in this report.
The Company’s fiscal year is comprised of 52 or 53 weeks, ending on the Saturday closest to the last day of January. The Statement of
Operations Data for the 52 weeks ended January 31, 1998 (fiscal 1997), the 53 weeks ended February 1, 1997 (fiscal 1996) and the 52 weeks
ended January 27, 1996 (fiscal 1995) and the Balance Sheet Data as of January 31, 1998 and February 1,1997 are derived from, and are
qualified by reference to, audited consolidated financial statements which are included elsewhere in this report. The Statement of Operations
Data for the 52 weeks ended January 28, 1995 (fiscal 1994) and January 29, 1994 (fiscal 1993) and the Balance Sheet Data as of January
27, 1996, January 28, 1995 and January 29, 1994 are derived from audited consolidated financial statements not included in this report.
Certain prior-period amounts have been reclassified for comparative purposes.
FISCAL YEAR 1997 1996 1995 1994 1993
(Thousands of dollars, except per share data)
STATEMENT OF OPERATIONS DATA:
Revenues
Barnes & Noble stores(1) $ 2,245,531 1,861,177 1,349,830 952,697 614,646
B. Dalton stores(2) 509,389 564,926 603,204 646,876 688,220
BarnesandNoble.com 14,601 — — — —
Other 27,331 22,021 23,866 23,158 34,520
Total revenues 2,796,852 2,448,124 1,976,900 1,622,731 1,337,386
Cost of sales and occupancy 2,019,291 1,785,392 1,444,555 1,192,123 989,526
Gross profit 777,561 662,732 532,345 430,608 347,860
Selling and administrative expenses 540,423 465,687 383,692 316,457 267,699
Depreciation and amortization 76,951 59,806 47,881 36,617 29,077
Pre-opening expenses 12,918 17,571 12,160 9,021 8,940
Restructuring charge(3) — — 123,768 — —
Operating profit (loss) 147,269 119,668 (35,156) 68,513 42,144
Interest expense, net and amortization of
deferred financing fees(4) 37,666 38,286 28,142 22,955 25,807
Earnings (loss) before provision (benefit) for
income taxes and extraordinary charge 109,603 81,382 (63,298) 45,558 16,337
Provision (benefit) for income taxes 44,935 30,157 (10,322) 20,085 8,584
Earnings (loss) before extraordinary charge 64,668 51,225 (52,976) 25,473 7,753
Extraordinary charge(5) 11,499 — — — —
Net earnings (loss)(6) $ 53,169 51,225 (52,976) 25,473 7,753
Earnings (loss) per common share(7)
Basic
Earnings (loss) before extraordinary charge $ 0.96 0.77 (0.85) 0.42 0.15
Extraordinary charge $ 0.17 ————
Net earnings (loss) $ 0.79 0.77 (0.85) 0.42 0.15
Diluted
Earnings (loss) before extraordinary charge $ 0.93 0.75 (0.85) 0.41 0.15
Extraordinary charge $ 0.17 ————
Net earnings (loss) $ 0.76 0.75 (0.85) 0.41 0.15
Weighted average common shares outstanding(7)
Basic 67,237,000 66,103,000 62,434,000 59,970,000 52,039,000
Diluted 69,836,000 67,886,000 62,434,000 61,560,000 52,255,000
11