Barclays 2007 Annual Report Download - page 12
Download and view the complete annual report
Please find page 12 of the 2007 Barclays annual report below. You can navigate through the pages in the report by either clicking on the pages listed below, or by using the keyword search tool below to find specific information within the annual report.-
 1
1 -
 2
2 -
 3
3 -
 4
4 -
 5
5 -
 6
6 -
 7
7 -
 8
8 -
 9
9 -
 10
10 -
 11
11 -
 12
12 -
 13
13 -
 14
14 -
 15
15 -
 16
16 -
 17
17 -
 18
18 -
 19
19 -
 20
20 -
 21
21 -
 22
22 -
23
-
24
-
25
-
26
-
27
-
28
-
29
-
30
-
31
-
32
-
33
-
34
-
35
-
36
-
37
-
38
-
39
-
40
-
41
-
42
-
43
-
44
-
45
-
46
-
47
-
48
-
49
-
50
-
51
-
52
-
53
-
54
-
55
-
56
-
57
-
58
-
59
-
60
-
61
-
62
-
63
-
64
-
65
-
66
-
67
-
68
-
69
-
70
-
71
-
72
-
73
-
74
-
75
-
76
-
77
-
78
-
79
-
80
-
81
-
82
-
83
-
84
-
85
-
86
-
87
-
88
-
89
-
90
-
91
-
92
-
93
-
94
-
95
-
96
-
97
-
98
-
99
-
100
-
101
-
102
-
103
-
104
-
105
-
106
-
107
-
108
-
109
-
110
-
111
-
112
-
113
-
114
-
115
-
116
-
117
-
118
-
119
-
120
-
121
-
122
-
123
-
124
-
125
-
126
-
127
-
128
-
129
-
130
-
131
-
132
-
133
-
134
-
135
-
136
-
137
-
138
-
139
-
140
-
141
-
142
-
143
-
144
-
145
-
146
-
147
-
148
-
149
-
150
-
151
-
152
-
153
-
154
-
155
-
156
-
157
-
158
-
159
-
160
-
161
-
162
-
163
-
164
-
165
-
166
-
167
-
168
-
169
-
170
-
171
-
172
-
173
-
174
-
175
-
176
-
177
-
178
-
179
-
180
-
181
-
182
-
183
-
184
-
185
-
186
-
187
-
188
-
189
-
190
-
191
-
192
-
193
-
194
-
195
-
196
-
197
-
198
-
199
-
200
-
201
-
202
-
203
-
204
-
205
-
206
-
207
-
208
-
209
-
210
-
211
-
212
-
213
-
214
-
215
-
216
-
217
-
218
-
219
-
220
-
221
-
222
-
223
-
224
-
225
-
226
-
227
-
228
-
229
-
230
-
231
-
232
-
233
-
234
-
235
-
236
-
237
-
238
-
239
-
240
-
241
-
242
-
243
-
244
-
245
-
246
-
247
-
248
-
249
-
250
-
251
-
252
-
253
-
254
-
255
-
256
-
257
-
258
-
259
-
260
-
261
-
262
-
263
-
264
-
265
-
266
-
267
-
268
-
269
-
270
-
271
-
272
-
273
-
274
-
275
-
276
-
277
-
278
-
279
-
280
-
281
-
282
-
283
-
284
-
285
-
286
-
287
-
288
-
289
-
290
-
291
-
292
-
293
-
294
-
295
-
296
 |
 |

Key performance indicators
10 Barclays PLC Annual Report 2007
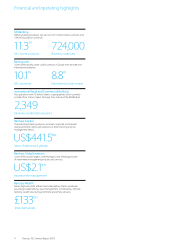
Total Shareholder Return
Total Shareholder Return (TSR) is defined as the value created
for shareholders through share price appreciation, plus reinvested
dividend payments.
At the end of 2003, Barclays established a set of four year performance
goals for the period 2004 to 2007 inclusive. The primary goal was to achieve
top quartile TSR relative to a peer group of financial services companies.
The TSR peer group is regularly reviewed to ensure that it remains aligned
to our business mix and the direction and scale of our ambition. The peer
group for 2007 was: Banco Santander, BBVA, BNP Paribas, Citigroup,
Deutsche Bank, HBOS, HSBC, JP Morgan Chase, Lloyds TSB, Royal Bank
of Scotland and UBS. Banco Santander replaced ABN AMRO in this peer
group during 2007. Barclays delivered TSR of 20.4% for the goal period
and was positioned 8th within its peer group (third quartile) for the goal
period commencing 1st January 2004.
Economic Profit
Economic profit (EP) is the measurement used to support the pursuit of
the top quartile TSR goal. EP is profit after tax and minorities less a capital
charge (average shareholder’s equity and goodwill excluding minority
interests multiplied by the Group cost of capital). Barclays uses EP, a non-
IFRS measure, as a key indicator of performance because it believes that
it provides important discipline in decision making. Barclays believes
that EP encourages both profitable growth and the efficient use of capital.
At the time of setting the TSR goal, we estimated that achieving top
quartile TSR would require the achievement of compound annual
growth in economic profit in the range of 10% to 13% per annum
(£6.5bn to £7.0bn of cumulative economic profit) over the 2004 to 2007
goal period. Economic profit for 2007 was £2.3bn, which, added to the
£6.0bn generated in 2004, 2005 and 2006, delivered a cumulative total
of £8.3bn for the goal period. Therefore Barclays has delivered 128% of
the minimum range and 119% of the upper range of the cumulative
economic profit goal in the goal period.
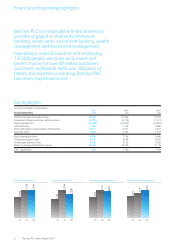
Barclays strategic priorities are to:
–Build the best bank in the UK
–Accelerate growth of global businesses
–Develop Retail and Commercial Banking
activities in selected countries outside the UK
–Enhance operational excellence
A range of financial and non-financial key performance
indicators (KPIs) are monitored at both a Group and
business level to assess progress against these
strategic goals. Group KPIs are detailed here, business
specific performance indicators are detailed within the
analysis of results by business. Further non-financial
performance indicators are detailed within the Corporate
sustainability section.
Economic Profit
04 05 06 07
1,568
3,320
6,024
8,313
Target range
Actual
Total Shareholder Return £
02
Year ended 31st December
03 04 05 06 07
100
136
131
158
181
195
100
118
167 181
226
163
FTSE 100 Index
Barclays PLC