Bank of Montreal 2015 Annual Report Download - page 3
Download and view the complete annual report
Please find page 3 of the 2015 Bank of Montreal annual report below. You can navigate through the pages in the report by either clicking on the pages listed below, or by using the keyword search tool below to find specific information within the annual report.-
 1
1 -
 2
2 -
 3
3 -
 4
4 -
 5
5 -
 6
6 -
 7
7 -
 8
8 -
 9
9 -
 10
10 -
 11
11 -
 12
12 -
 13
13 -
 14
14 -
15
-
16
-
17
-
18
-
19
-
20
-
21
-
22
-
23
-
24
-
25
-
26
-
27
-
28
-
29
-
30
-
31
-
32
-
33
-
34
-
35
-
36
-
37
-
38
-
39
-
40
-
41
-
42
-
43
-
44
-
45
-
46
-
47
-
48
-
49
-
50
-
51
-
52
-
53
-
54
-
55
-
56
-
57
-
58
-
59
-
60
-
61
-
62
-
63
-
64
-
65
-
66
-
67
-
68
-
69
-
70
-
71
-
72
-
73
-
74
-
75
-
76
-
77
-
78
-
79
-
80
-
81
-
82
-
83
-
84
-
85
-
86
-
87
-
88
-
89
-
90
-
91
-
92
-
93
-
94
-
95
-
96
-
97
-
98
-
99
-
100
-
101
-
102
-
103
-
104
-
105
-
106
-
107
-
108
-
109
-
110
-
111
-
112
-
113
-
114
-
115
-
116
-
117
-
118
-
119
-
120
-
121
-
122
-
123
-
124
-
125
-
126
-
127
-
128
-
129
-
130
-
131
-
132
-
133
-
134
-
135
-
136
-
137
-
138
-
139
-
140
-
141
-
142
-
143
-
144
-
145
-
146
-
147
-
148
-
149
-
150
-
151
-
152
-
153
-
154
-
155
-
156
-
157
-
158
-
159
-
160
-
161
-
162
-
163
-
164
-
165
-
166
-
167
-
168
-
169
-
170
-
171
-
172
-
173
-
174
-
175
-
176
-
177
-
178
-
179
-
180
-
181
-
182
-
183
-
184
-
185
-
186
-
187
-
188
-
189
-
190
-
191
-
192
-
193
 |
 |

2 3BMO Financial Group 198th Annual Report 2015 3
Financial Snapshot
Reported
1
Adjusted
1,2
As at or for th
e y
ear ended October 31
(Canadian $ in millions, except as noted)
2015
2014
2015
20
14
Revenue
3
(p 38)
19,389
18,223
19,391
18,223
Insurance claims, commissions
and changes in policy benefit
liabilities
3
(CCPB)
(p 41)
1,254
1,505
1,2
54
4
1,50
5
Revenue, net of CCPB
(p 38)
18,135
16,718
18,137
16,7
18
Provision for credit losses
(p 4
2)
612
561
612
561
Non-interest expense
(p 43)
12,182
10,921
11,819
10,761
Net income
(p 34)
4,405
4,333
4,681
4,45
3
Earnings per share
–
diluted ($)
(p 34)
6.
6
57
57
6.41
7.00
6.
59
Return on equity
(p 35)
12.5%
14.0%
13.3%
14.4
%
Operating leverage,
net of CCPB
(p 43)
(3.0)%
(2.7)%
(1.3)%
(1.6)%
Basel III Common Equity
Tier 1 Ratio
(p 35)
10.7%
10.1%
10.
7%
%
10.1
%
Net Income by Segment
Canadian P&C
(p 48)
2,104
2,016
2,108
2,020
U.S. P&C
(p 51)
827
654
880
706
Wealth Management
(p 55)
850
780
9
9
55
55
84
3
BMO Capital Markets
(p 5
8)
1,032
1,077
1,034
1,07
8
Corporate Services
4
(p 62)
(408)
(194)
(296)
(194)
Net income
(p 34)
4,405
4,333
4
4
4
,6
,6
,6
81
4,45
3
U.S. P&C (US$ in millions)
(p 51)
659
597
7
01
01
1
64
4
1
Effective November 1, 2014, BMO adopted several new and amended accounting pronouncements
issued by the International Accounting Standards Board, which are outlined in Note 1 on page 140
of the financial statements. The adoption of these new and amended accounting standards only
impacted our results prospectively. Certain other prior year data has been reclassified to conform
with the current year’s presentation. See pages 45 and 46.
2
Adjusted results are non-GAAP and are discussed in the Non-GAAP Measures section on page 33.
Management assesses performance on a reported basis and on an adjusted basis and considers
both to be useful in assessing the underlying ongoing business performance. Presenting results on
both base
s p
rovides readers with a better understandin
g o
f how man
age
ment assesses results.
3
Effective the first quarter of 2015, insurance claims, commissions and changes in policy benefit
liabilities (CCPB) are reported separately. They were previously reported as a reduction in insurance
revenue in non-interest revenue. Prior period amounts and ratios have been reclassified.
4
Corporate Services, including Technology & Operations.
Bank of Montreal brands the organization’s member companies as BMO Financial Group.
Note 28 on page 196 of the financial statements lists the intercorporate relationships among
Bank of Montreal and its significant subsidiaries.
2
BMO Financial Group 198th Annual Report 2015
Mark Gilbert,
Commercial Account Manager,
Mid Market.
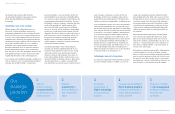
Who We Are
Established in 1817, BMO Financial Group is
a highly diversified financial services provider
based in North America. With total assets of
$642 billion and close to 47,000 employees,
BMO provides a broad range of personal and
commercial banking, wealth management and
investment banking products and services to
more than 12 million customers and conducts
business through three operating groups: Personal
and Commercial Banking, Wealth Management
and BMO Capital Markets.