BT 2002 Annual Report Download - page 4
Download and view the complete annual report
Please find page 4 of the 2002 BT annual report below. You can navigate through the pages in the report by either clicking on the pages listed below, or by using the keyword search tool below to find specific information within the annual report.-
 1
1 -
 2
2 -
 3
3 -
 4
4 -
 5
5 -
 6
6 -
 7
7 -
 8
8 -
 9
9 -
 10
10 -
 11
11 -
 12
12 -
 13
13 -
 14
14 -
 15
15 -
16
-
17
-
18
-
19
-
20
-
21
-
22
-
23
-
24
-
25
-
26
-
27
-
28
-
29
-
30
-
31
-
32
-
33
-
34
-
35
-
36
-
37
-
38
-
39
-
40
-
41
-
42
-
43
-
44
-
45
-
46
-
47
-
48
-
49
-
50
-
51
-
52
-
53
-
54
-
55
-
56
-
57
-
58
-
59
-
60
-
61
-
62
-
63
-
64
-
65
-
66
-
67
-
68
-
69
-
70
-
71
-
72
-
73
-
74
-
75
-
76
-
77
-
78
-
79
-
80
-
81
-
82
-
83
-
84
-
85
-
86
-
87
-
88
-
89
-
90
-
91
-
92
-
93
-
94
-
95
-
96
-
97
-
98
-
99
-
100
-
101
-
102
-
103
-
104
-
105
-
106
-
107
-
108
-
109
-
110
-
111
-
112
-
113
-
114
-
115
-
116
-
117
-
118
-
119
-
120
-
121
-
122
-
123
-
124
-
125
-
126
-
127
-
128
-
129
-
130
-
131
-
132
-
133
-
134
-
135
-
136
-
137
-
138
-
139
-
140
-
141
-
142
-
143
-
144
-
145
-
146
-
147
-
148
-
149
-
150
-
151
-
152
-
153
-
154
-
155
-
156
-
157
-
158
-
159
-
160
 |
 |

BT Group Annual Report and Form 20-F 2002 3
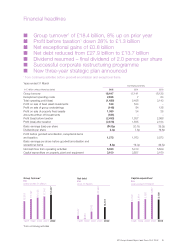
Financial headlines
■Group turnover1of £18.4 billion, 8% up on prior year
■Profit before taxation1down 28% to £1.3 billion
■Net exceptional gains of £0.8 billion
■Net debt reduced from £27.9 billion to £13.7 billion
■Dividend resumed – final dividend of 2.0 pence per share
■Successful corporate restructuring programme
■New three-year strategic plan announced
1from continuing activities before goodwill amortisation and exceptional items
Years ended 31 March Continuing activities
In £ million unless otherwise stated 2002 2001 2000
Group turnover 18,447 17,141 16,125
Exceptional operating costs 2,696 764
Total operating profit (loss) (1,489) 2,456 3,143
Profit on sale of fixed asset investments 169 534 –
Profit on sale of group undertakings (148) 84 126
Profit on sale of property fixed assets 1,089 34 26
Amounts written off investments (535) ––
Profit (loss) before taxation (2,493) 1,937 2,968
Profit (loss) after taxation (2,878) 1,505 2,104
Basic earnings (loss) per share (34.8)p 20.7p 29.2p
Dividends per share 2.0p 7.8p 19.6p
Profit before goodwill amortisation, exceptional items
and taxation 1,273 1,763 2,973
Basic earnings per share before goodwill amortisation and
exceptional items 8.8p 19.3p 29.5p
Net cash flow from operating activities 5,023 5,410 5,609
Capital expenditure on property, plant and equipment 3,100 3,857 3,160
N
e
t
debt
£
m
as
a
t
3
1 M
a
r
c
h
2
from continuin
g
activitie
s
1
998
1
999
2
000
2
001
2
002
953
3,
977
8
,
700
2
7
,
942
1
3
,
701
Grou
p
turnove
r
2
£
m
y
ears ended 31 March
1
998
1
999
2
000
2
001
2
002
1
3
,
651
1
5
,
197
1
6
,
125
1
7
,
141
1
8
,
447
Ca
p
ital ex
p
enditur
e
2
£
m
y
ears ended 31 March
1
998
1
999
2
000
2
001
2
002
2,
720
2,
811
3,
160
3,
857
3,
100