BP 2014 Annual Report Download - page 184
Download and view the complete annual report
Please find page 184 of the 2014 BP annual report below. You can navigate through the pages in the report by either clicking on the pages listed below, or by using the keyword search tool below to find specific information within the annual report.-
 1
1 -
2
-
3
-
4
-
5
-
6
-
7
-
8
-
9
-
10
-
11
-
12
-
13
-
14
-
15
-
16
-
17
-
18
-
19
-
20
-
21
-
22
-
23
-
24
-
25
-
26
-
27
-
28
-
29
-
30
-
31
-
32
-
33
-
34
-
35
-
36
-
37
-
38
-
39
-
40
-
41
-
42
-
43
-
44
-
45
-
46
-
47
-
48
-
49
-
50
-
51
-
52
-
53
-
54
-
55
-
56
-
57
-
58
-
59
-
60
-
61
-
62
-
63
-
64
-
65
-
66
-
67
-
68
-
69
-
70
-
71
-
72
-
73
-
74
-
75
-
76
-
77
-
78
-
79
-
80
-
81
-
82
-
83
-
84
-
85
-
86
-
87
-
88
-
89
-
90
-
91
-
92
-
93
-
94
-
95
-
96
-
97
-
98
-
99
-
100
-
101
-
102
-
103
-
104
-
105
-
106
-
107
-
108
-
109
-
110
-
111
-
112
-
113
-
114
-
115
-
116
-
117
-
118
-
119
-
120
-
121
-
122
-
123
-
124
-
125
-
126
-
127
-
128
-
129
-
130
-
131
-
132
-
133
-
134
-
135
-
136
-
137
-
138
-
139
-
140
-
141
-
142
-
143
-
144
-
145
-
146
-
147
-
148
-
149
-
150
-
151
-
152
-
153
-
154
-
155
-
156
-
157
-
158
-
159
-
160
-
161
-
162
-
163
-
164
-
165
-
166
-
167
-
168
-
169
-
170
-
171
-
172
-
173
-
 174
174 -
 175
175 -
 176
176 -
 177
177 -
 178
178 -
 179
179 -
 180
180 -
 181
181 -
 182
182 -
 183
183 -
 184
184 -
 185
185 -
 186
186 -
 187
187 -
 188
188 -
 189
189 -
 190
190 -
 191
191 -
 192
192 -
 193
193 -
 194
194 -
195
-
196
-
197
-
198
-
199
-
200
-
201
-
202
-
203
-
204
-
205
-
206
-
207
-
208
-
209
-
210
-
211
-
212
-
213
-
214
-
215
-
216
-
217
-
218
-
219
-
220
-
221
-
222
-
223
-
224
-
225
-
226
-
227
-
228
-
229
-
230
-
231
-
232
-
233
-
234
-
235
-
236
-
237
-
238
-
239
-
240
-
241
-
242
-
243
-
244
-
245
-
246
-
247
-
248
-
249
-
250
-
251
-
252
-
253
-
254
-
255
-
256
-
257
-
258
-
259
-
260
-
261
-
262
-
263
 |
 |

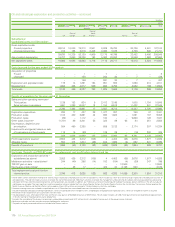
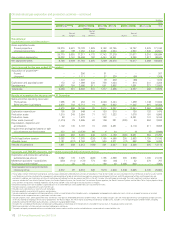
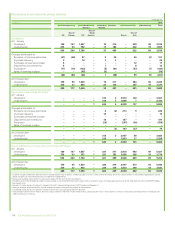
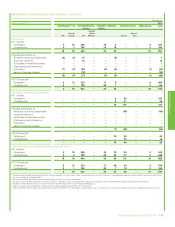
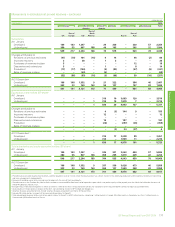
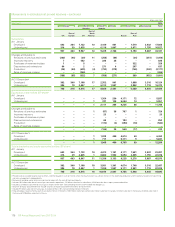
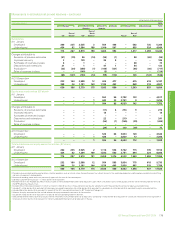
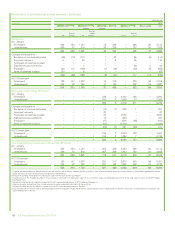
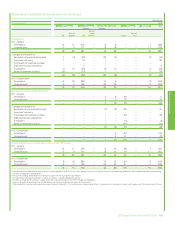
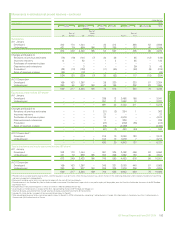
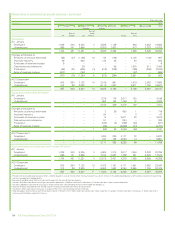
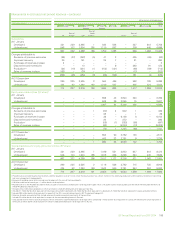
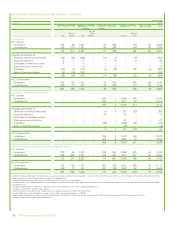
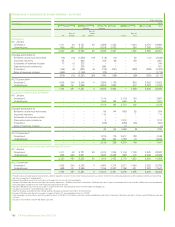
Movements in estimated net proved reserves – continued
million barrels
Crude oilab 2013
Europe North
America
South
America
Africa Asia Australasia Total
UK
Rest of
Europe USc
Rest of
North
America Russia
Rest of
Asia
Subsidiaries
At 1 January
Developed 228 153 1,127 – 16 306 – 268 45 2,143
Undeveloped 426 73 818 – 20 236 – 137 34 1,743
654 226 1,945 – 36 542 – 405 79 3,886
Changes attributable to
Revisions of previous estimates (79) (15) (111) – 1 30 – 65 (5) (114)
Improved recovery 11 – 33 – 1 2 – 65 – 112
Purchases of reserves-in-place – – – – –––– – –
Discoveries and extensions – – 2 – – – – 39 3 44
Production (21) (11) (108) – (7) (79) – (52) (8) (285)
Sales of reserves-in-place (31) – (1) – –––– –(32)
(120) (26) (185) – (5) (47) – 117 (10) (276)
At 31 Decemberd
Developed 160 147 1,007 – 15 316 – 320 49 2,013
Undeveloped 374 53 752 – 17 180 – 202 19 1,597
534 200 1,760 – 31 495 – 522 69 3,610
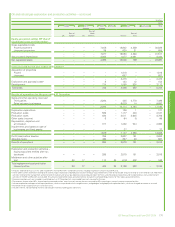
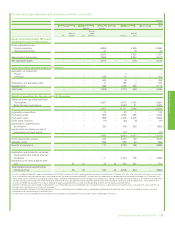
Equity-accounted entities (BP share)ef
At 1 January
Developed – – – – 336 3 2,433 198 – 2,970
Undeveloped – – – – 347 2 1,943 13 – 2,305
– – – – 683 5 4,376 211 – 5,275
Changes attributable to
Revisions of previous estimates – – – 1 (14) (1) 295 1 – 281
Improved recovery – – – – 27 – – – – 27
Purchases of reserves-in-place – – – – 34 – 4,550 – – 4,584
Discoveries and extensions – – – – 12 – 228 – – 240
Production – – – – (27) – (301) (85) – (412)
Sales of reserves-in-place – – – – (85) – (4,321) – – (4,406)
– – – 1 (53) (1) 451 (84) – 314
At 31 Decemberg
Developed – – – – 316 2 2,970 120 – 3,407
Undeveloped – – – 1 314 2 1,858 7 – 2,182
– – – 1 630 4 4,828 127 – 5,590
Total subsidiaries and equity-accounted entities (BP share)
At 1 January
Developed 228 153 1,127 – 352 309 2,433 466 45 5,113
Undeveloped 426 73 818 – 367 239 1,943 150 34 4,048
654 226 1,945 – 719 547 4,376 616 79 9,162
At 31 December
Developed 160 147 1,007 – 331 317 2,970 440 49 5,421
Undeveloped 374 53 752 1 331 182 1,858 209 19 3,779
534 200 1,760 1 661 499 4,828 649 69 9,200
aCrude oil includes condensate. Proved reserves exclude royalties due to others, whether payable in cash or in kind, where the royalty owner has a direct interest in the underlying production and the
option and ability to make lifting and sales arrangements independently.
bBecause of rounding, some totals may not exactly agree with the sum of their counterparts.
cProved reserves in the Prudhoe Bay field in Alaska include an estimated 72 million barrels upon which a net profits royalty will be payable over the life of the field under the terms of the BP Prudhoe
Bay Royalty Trust.
dIncludes 8 million barrels of crude oil in respect of the 30% non-controlling interest in BP Trinidad and Tobago LLC.
eVolumes of equity-accounted entities include volumes of equity-accounted investments of those entities.
fIncludes 23 million barrels of crude oil in respect of the 0.47% non-controlling interest in Rosneft.
gTotal proved crude oil reserves held as part of our equity interest in Rosneft is 4,860 million barrels, comprising less than 1 million barrels in Vietnam and Canada, 32 million barrels in Venezuela and
4,827 million barrels in Russia.
180 BP Annual Report and Form 20-F 2014