BP 2014 Annual Report Download - page 144
Download and view the complete annual report
Please find page 144 of the 2014 BP annual report below. You can navigate through the pages in the report by either clicking on the pages listed below, or by using the keyword search tool below to find specific information within the annual report.-
 1
1 -
2
-
3
-
4
-
5
-
6
-
7
-
8
-
9
-
10
-
11
-
12
-
13
-
14
-
15
-
16
-
17
-
18
-
19
-
20
-
21
-
22
-
23
-
24
-
25
-
26
-
27
-
28
-
29
-
30
-
31
-
32
-
33
-
34
-
35
-
36
-
37
-
38
-
39
-
40
-
41
-
42
-
43
-
44
-
45
-
46
-
47
-
48
-
49
-
50
-
51
-
52
-
53
-
54
-
55
-
56
-
57
-
58
-
59
-
60
-
61
-
62
-
63
-
64
-
65
-
66
-
67
-
68
-
69
-
70
-
71
-
72
-
73
-
74
-
75
-
76
-
77
-
78
-
79
-
80
-
81
-
82
-
83
-
84
-
85
-
86
-
87
-
88
-
89
-
90
-
91
-
92
-
93
-
94
-
95
-
96
-
97
-
98
-
99
-
100
-
101
-
102
-
103
-
104
-
105
-
106
-
107
-
108
-
109
-
110
-
111
-
112
-
113
-
114
-
115
-
116
-
117
-
118
-
119
-
120
-
121
-
122
-
123
-
124
-
125
-
126
-
127
-
128
-
129
-
130
-
131
-
132
-
133
-
 134
134 -
 135
135 -
 136
136 -
 137
137 -
 138
138 -
 139
139 -
 140
140 -
 141
141 -
 142
142 -
 143
143 -
 144
144 -
 145
145 -
 146
146 -
 147
147 -
 148
148 -
 149
149 -
 150
150 -
 151
151 -
 152
152 -
 153
153 -
 154
154 -
155
-
156
-
157
-
158
-
159
-
160
-
161
-
162
-
163
-
164
-
165
-
166
-
167
-
168
-
169
-
170
-
171
-
172
-
173
-
174
-
175
-
176
-
177
-
178
-
179
-
180
-
181
-
182
-
183
-
184
-
185
-
186
-
187
-
188
-
189
-
190
-
191
-
192
-
193
-
194
-
195
-
196
-
197
-
198
-
199
-
200
-
201
-
202
-
203
-
204
-
205
-
206
-
207
-
208
-
209
-
210
-
211
-
212
-
213
-
214
-
215
-
216
-
217
-
218
-
219
-
220
-
221
-
222
-
223
-
224
-
225
-
226
-
227
-
228
-
229
-
230
-
231
-
232
-
233
-
234
-
235
-
236
-
237
-
238
-
239
-
240
-
241
-
242
-
243
-
244
-
245
-
246
-
247
-
248
-
249
-
250
-
251
-
252
-
253
-
254
-
255
-
256
-
257
-
258
-
259
-
260
-
261
-
262
-
263
 |
 |

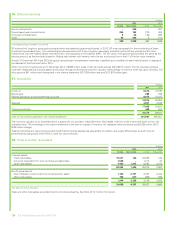
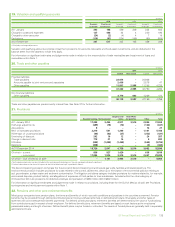
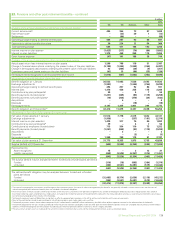
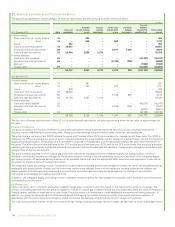
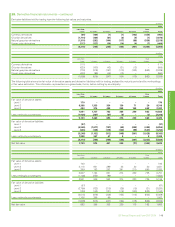
22. Pensions and other post-retirement benefits – continued
$ million
2013
UK US Eurozone Other Total
Analysis of the amount charged to profit before interest and taxation
Current service costa497 407 81 96 1,081
Past service costb(22) (49) 26 1 (44)
Settlement – – – (1) (1)
Operating charge relating to defined benefit plans 475 358 107 96 1,036
Payments to defined contribution plans 24 223 9 44 300
Total operating charge 499 581 116 140 1,336
Interest income on plan assetsa(1,139) (240) (63) (67) (1,509)
Interest on plan liabilities 1,223 406 254 106 1,989
Other finance expense 84 166 191 39 480
Analysis of the amount recognized in other comprehensive income
Actual asset return less interest income on plan assets 2,671 730 15 99 3,515
Change in financial assumptions underlying the present value of the plan liabilities 68 1,160 62 213 1,503
Change in demographic assumptions underlying the present value of the plan liabilities – 14 – (65) (51)
Experience gains and losses arising on the plan liabilities 43 (249) 2 1 (203)
Remeasurements recognized in other comprehensive income 2,782 1,655 79 248 4,764
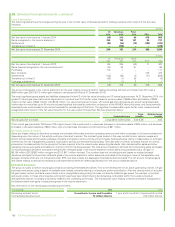
Movements in benefit obligation during the year
Benefit obligation at 1 January 29,323 12,874 7,364 2,720 52,281
Exchange adjustments 706 – 323 (192) 837
Operating charge relating to defined benefit plans 475 358 107 96 1,036
Interest cost 1,223 406 254 106 1,989
Contributions by plan participantsc37 – 4 9 50
Benefit payments (funded plans)d(1,087) (1,365) (87) (105) (2,644)
Benefit payments (unfunded plans)d(5) (285) (365) (29) (684)
Disposals (9) (61) – (13) (83)
Remeasurementse(111) (925) (64) (149) (1,249)
Benefit obligation at 31 Decemberaf 30,552 11,002 7,536 2,443 51,533
Movements in fair value of plan assets during the year
Fair value of plan assets at 1 January 27,346 7,787 1,710 1,823 38,666
Exchange adjustments 822 – 92 (129) 785
Interest income on plan assetsa1,139 240 63 67 1,509
Contributions by plan participantsc37 – 4 9 50
Contributions by employers (funded plans) 597 386 218 71 1,272
Benefit payments (funded plans)d(1,087) (1,365) (87) (105) (2,644)
Disposals (9) – – (13) (22)
Remeasurementse2,671 730 15 99 3,515
Fair value of plan assets at 31 December 31,516 7,778 2,015 1,822 43,131
Surplus (deficit) at 31 December 964 (3,224) (5,521) (621) (8,402)
Represented by
Asset recognized 1,291 6 20 59 1,376
Liability recognized (327) (3,230) (5,541) (680) (9,778)
964 (3,224) (5,521) (621) (8,402)
The surplus (deficit) may be analysed between funded and unfunded plans as follows
Funded 1,285 (5) (180) (140) 960
Unfunded (321) (3,219) (5,341) (481) (9,362)
964 (3,224) (5,521) (621) (8,402)
The defined benefit obligation may be analysed between funded and unfunded
plans as follows
Funded (30,231) (7,783) (2,195) (1,962) (42,171)
Unfunded (321) (3,219) (5,341) (481) (9,362)
(30,552) (11,002) (7,536) (2,443) (51,533)
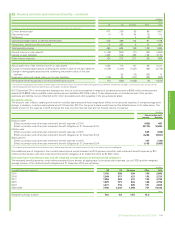
aThe costs of managing plan investments are offset against the investment return, the costs of administering pension plan benefits are generally included in current service cost and the costs of
administering other post-retirement benefit plans are included in the benefit obligation.
bPast service costs include a credit of $73 million as the result of a curtailment in the pension arrangement of a number of employees in the UK and US following divestment transactions. A charge of
$29 million for special termination benefits represents the increased liability arising as a result of early retirements occurring as part of restructuring programmes.
cMost of the contributions made by plan participants into UK pension plans were made under salary sacrifice.
dThe benefit payments amount shown above comprises $3,269 million benefits plus $59 million of plan expenses incurred in the administration of the benefit.
eThe actual return on plan assets is made up of the sum of the interest income on plan assets and the remeasurement of plan assets as disclosed above.
fThe benefit obligation for the US is made up of $8,364 million for pension liabilities and $2,638 million for other post-retirement benefit liabilities (which are unfunded and are primarily retiree medical
liabilities). The benefit obligation for the Eurozone includes $4,874 million for pension liabilities in Germany which is largely unfunded.
140 BP Annual Report and Form 20-F 2014