BP 2013 Annual Report Download - page 92
Download and view the complete annual report
Please find page 92 of the 2013 BP annual report below. You can navigate through the pages in the report by either clicking on the pages listed below, or by using the keyword search tool below to find specific information within the annual report.-
 1
1 -
2
-
3
-
4
-
5
-
6
-
7
-
8
-
9
-
10
-
11
-
12
-
13
-
14
-
15
-
16
-
17
-
18
-
19
-
20
-
21
-
22
-
23
-
24
-
25
-
26
-
27
-
28
-
29
-
30
-
31
-
32
-
33
-
34
-
35
-
36
-
37
-
38
-
39
-
40
-
41
-
42
-
43
-
44
-
45
-
46
-
47
-
48
-
49
-
50
-
51
-
52
-
53
-
54
-
55
-
56
-
57
-
58
-
59
-
60
-
61
-
62
-
63
-
64
-
65
-
66
-
67
-
68
-
69
-
70
-
71
-
72
-
73
-
74
-
75
-
76
-
77
-
78
-
79
-
80
-
81
-
 82
82 -
 83
83 -
 84
84 -
 85
85 -
 86
86 -
 87
87 -
 88
88 -
 89
89 -
 90
90 -
 91
91 -
 92
92 -
 93
93 -
 94
94 -
 95
95 -
 96
96 -
 97
97 -
 98
98 -
 99
99 -
 100
100 -
 101
101 -
 102
102 -
103
-
104
-
105
-
106
-
107
-
108
-
109
-
110
-
111
-
112
-
113
-
114
-
115
-
116
-
117
-
118
-
119
-
120
-
121
-
122
-
123
-
124
-
125
-
126
-
127
-
128
-
129
-
130
-
131
-
132
-
133
-
134
-
135
-
136
-
137
-
138
-
139
-
140
-
141
-
142
-
143
-
144
-
145
-
146
-
147
-
148
-
149
-
150
-
151
-
152
-
153
-
154
-
155
-
156
-
157
-
158
-
159
-
160
-
161
-
162
-
163
-
164
-
165
-
166
-
167
-
168
-
169
-
170
-
171
-
172
-
173
-
174
-
175
-
176
-
177
-
178
-
179
-
180
-
181
-
182
-
183
-
184
-
185
-
186
-
187
-
188
-
189
-
190
-
191
-
192
-
193
-
194
-
195
-
196
-
197
-
198
-
199
-
200
-
201
-
202
-
203
-
204
-
205
-
206
-
207
-
208
-
209
-
210
-
211
-
212
-
213
-
214
-
215
-
216
-
217
-
218
-
219
-
220
-
221
-
222
-
223
-
224
-
225
-
226
-
227
-
228
-
229
-
230
-
231
-
232
-
233
-
234
-
235
-
236
-
237
-
238
-
239
-
240
-
241
-
242
-
243
-
244
-
245
-
246
-
247
-
248
-
249
-
250
-
251
-
252
-
253
-
254
-
255
-
256
-
257
-
258
-
259
-
260
-
261
-
262
-
263
-
264
-
265
-
266
-
267
-
268
-
269
-
270
-
271
-
272
-
273
-
274
-
275
-
276
-
277
-
278
-
279
-
280
-
281
-
282
-
283
-
284
-
285
-
286
-
287
-
288
 |
 |

BP Annual Report and Form 20-F 201388
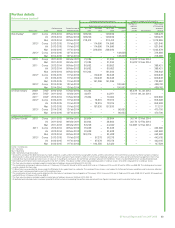
Performance shares
Framework
Performance shares were awarded to each executive director in early 2011
with vesting after three years dependent on performance relative to
measures reflecting the company’s strategic priorities in the period after
the Deepwater Horizon accident. For the 2011-2013 plan, vesting was
based 50% on TSR compared to the peer group, 20% on reserves
replacement ratio, also relative to the peer group, and 30% on a set of
strategic imperatives for rebuilding trust. These centred on S&OR
management, rebuilding BP’s external reputation, and reinforcing staff
alignment and morale.
The peer group includes ExxonMobil, Shell, Chevron and Total.
ConocoPhillips was originally included as part of the peer group but was
removed following its demerger (with no impact on outcome in any case).
Vesting was set at 100%, 70% and 35% for performance equivalent to
first, second and third rank respectively and none for fourth or fifth place of
the peer group.
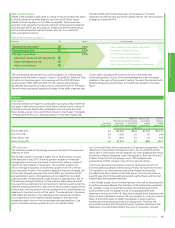
2013 outcomes
Overall, 39.5% of the shares awarded in the 2011-2013 plan are expected
to vest, based on results as shown in the table above.
Relative TSR was weighted heaviest, reflecting the high strategic priority
on restoring value. Outcomes failed to meet the threshold required and so
no shares vested for this measure.
Reserves replacement has been very positive and we expect that BP will
be in second place amongst the oil majors. Since the actual results of the
other majors are not publicly available until their respective annual reports
are published, the committee will review the outcomes when all
information is confirmed and decide then on the final vesting. For the
purposes of this report, and in accordance with UK regulations, second
place has been assumed. Any adjustment to this will be reported in next
year’s annual report on remuneration.
The committee’s review also concluded that progress against the three
strategic imperatives has been positive. S&OR management culture has
shown steady improvement and its high importance increasingly
embedded in the minds of employees, as demonstrated by our internal
surveys. Moreover the S&OR performance metrics have consistently
improved including against those of our peers. BP’s external reputation has
similarly shown steady improvement as measured by external surveys
assessing reputation amongst different groups in key countries. Finally,
staff alignment and morale has been reassuringly positive in the aftermath
of the Deepwater Horizon accident, with internal surveys demonstrating
improvements and a high scoring of measures related to group priorities
including safety and trust.
As in past years, the committee also considers the overall performance of
the company during the period and whether any other relevant factors
should be taken into account. Following this review, the committee
concluded that a 39.5% vesting was a fair reflection of overall performance
pending confirmation of the reserves replacement result. This will result in
the vesting as shown in the table below.
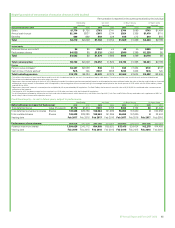
2011-2013 performance shares outcome
Shares
awarded
Shares vested
inc dividends
Value of
vested shares
Bob Dudley 1,330,332 596,028 $4,521,866
Iain Conn 623,025 283,920 £1,331,585
Dr Brian Gilvary 90,000 102,550 £504,509
Dr Byron Grote 654,498 293,232 $2,224,653
Dr Brian Gilvary’s vesting reflects awards granted prior to him joining the
board under equivalent plans below board level which have vested in early
2014. Dr Byron Grote’s award has been prorated to reflect his service prior
to retirement.
Information on performance shares awarded in early 2013, relating to the
2013-2015 period, was set out in last year’s report and a summary is
included in the table on page 85.
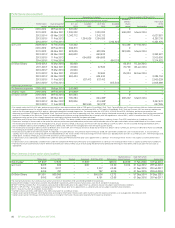
2011-2013 performance shares outcome
Measures Weight Outcomes
Threshold Max Result %
of max
Total shareholder return 50.0% 0%
Reserves replacement 20.0% 70%
Strategic imperatives 30.0%
Safety and operational risk management 10.0% 95%
Rebuilding external reputation 10.0% 80%
Staff alignment and morale 10.0% 80%
Overall outcome 39.5%