BP 2013 Annual Report Download - page 169
Download and view the complete annual report
Please find page 169 of the 2013 BP annual report below. You can navigate through the pages in the report by either clicking on the pages listed below, or by using the keyword search tool below to find specific information within the annual report.-
 1
1 -
2
-
3
-
4
-
5
-
6
-
7
-
8
-
9
-
10
-
11
-
12
-
13
-
14
-
15
-
16
-
17
-
18
-
19
-
20
-
21
-
22
-
23
-
24
-
25
-
26
-
27
-
28
-
29
-
30
-
31
-
32
-
33
-
34
-
35
-
36
-
37
-
38
-
39
-
40
-
41
-
42
-
43
-
44
-
45
-
46
-
47
-
48
-
49
-
50
-
51
-
52
-
53
-
54
-
55
-
56
-
57
-
58
-
59
-
60
-
61
-
62
-
63
-
64
-
65
-
66
-
67
-
68
-
69
-
70
-
71
-
72
-
73
-
74
-
75
-
76
-
77
-
78
-
79
-
80
-
81
-
82
-
83
-
84
-
85
-
86
-
87
-
88
-
89
-
90
-
91
-
92
-
93
-
94
-
95
-
96
-
97
-
98
-
99
-
100
-
101
-
102
-
103
-
104
-
105
-
106
-
107
-
108
-
109
-
110
-
111
-
112
-
113
-
114
-
115
-
116
-
117
-
118
-
119
-
120
-
121
-
122
-
123
-
124
-
125
-
126
-
127
-
128
-
129
-
130
-
131
-
132
-
133
-
134
-
135
-
136
-
137
-
138
-
139
-
140
-
141
-
142
-
143
-
144
-
145
-
146
-
147
-
148
-
149
-
150
-
151
-
152
-
153
-
154
-
155
-
156
-
157
-
158
-
 159
159 -
 160
160 -
 161
161 -
 162
162 -
 163
163 -
 164
164 -
 165
165 -
 166
166 -
 167
167 -
 168
168 -
 169
169 -
 170
170 -
 171
171 -
 172
172 -
 173
173 -
 174
174 -
 175
175 -
 176
176 -
 177
177 -
 178
178 -
 179
179 -
180
-
181
-
182
-
183
-
184
-
185
-
186
-
187
-
188
-
189
-
190
-
191
-
192
-
193
-
194
-
195
-
196
-
197
-
198
-
199
-
200
-
201
-
202
-
203
-
204
-
205
-
206
-
207
-
208
-
209
-
210
-
211
-
212
-
213
-
214
-
215
-
216
-
217
-
218
-
219
-
220
-
221
-
222
-
223
-
224
-
225
-
226
-
227
-
228
-
229
-
230
-
231
-
232
-
233
-
234
-
235
-
236
-
237
-
238
-
239
-
240
-
241
-
242
-
243
-
244
-
245
-
246
-
247
-
248
-
249
-
250
-
251
-
252
-
253
-
254
-
255
-
256
-
257
-
258
-
259
-
260
-
261
-
262
-
263
-
264
-
265
-
266
-
267
-
268
-
269
-
270
-
271
-
272
-
273
-
274
-
275
-
276
-
277
-
278
-
279
-
280
-
281
-
282
-
283
-
284
-
285
-
286
-
287
-
288
 |
 |

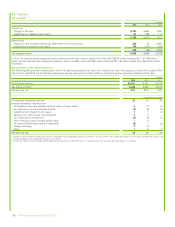
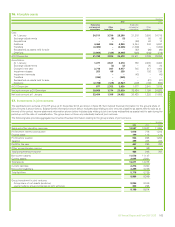
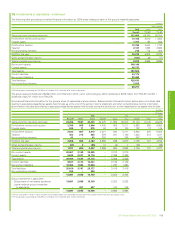
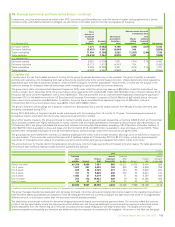
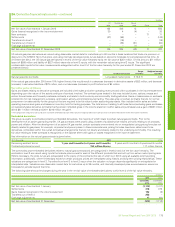
18. Investments in associates – continued
The following table provides summarized financial information at 100% share relating to each of the group’s material associates.
$ million
Gross amount
2013 2012 2011
Rosneft TNK-BPaTNK-BP
Sales and other operating revenues 122,866 49,350 60,200
Profit before interest and taxation 14,106 8,810 11,984
Finance costs 1,337 168 264
Profit before taxation 12,769 8,642 11,720
Taxation 2,137 1,958 2,666
Non-controlling interests 213 712 684
Profit for the year 10,419 5,972 8,370
Other comprehensive income (441) 26 (77)
Total comprehensive income 9,978 5,998 8,293
Non-current assets 149,149
Current assets 48,775
Total assets 197,924
Current liabilities 43,175
Non-current liabilities 83,458
Total liabilities 126,633
Non-controlling interests 2,020
69,271
aBP ceased equity accounting for TNK-BP on 22 October 2012. See Note 6 for further information.
The group received dividends of $456 million from Rosneft in 2013, net of withholding tax (2012 dividends of $709 million from TNK-BP and 2011
dividends of $3,747 million from TNK-BP).
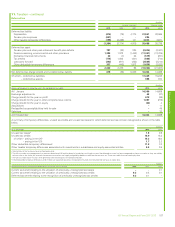
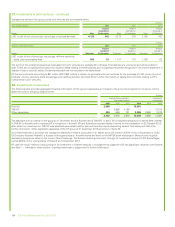
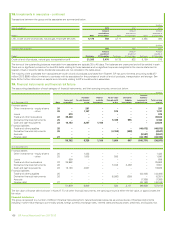
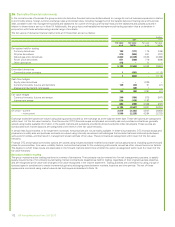
Summarized financial information for the group’s share of associates is shown below. Balance sheet information shown below does not include data
relating to associates classified as assets held for sale as at the end of the period. Income statement and other comprehensive income information
shown below includes data relating to associates classified as assets held for sale during the period prior to their classification as assets held for sale.
$ million
BP share
2013 2012 2011
RosneftaOther Total TNK-BPbOther Total TNK-BP Other Total
Sales and other operating revenues 24,266 7,967 32,233 24,675 11,965 36,640 30,100 12,145 42,245
Profit before interest and taxation 2,786 908 3,694 4,405 906 5,311 5,992 958 6,950
Finance costs 264 11 275 84 16 100 132 13 145
Profit before taxation 2,522 897 3,419 4,321 890 5,211 5,860 945 6,805
Taxation 422 213 635 979 201 1,180 1,333 214 1,547
Non-controlling interests 42 – 42 356 – 356 342 – 342
Profit for the year 2,058 684 2,742 2,986 689 3,675 4,185 731 4,916
Other comprehensive income (87) 2 (85) 13 (6) 7 (39) – (39)
Total comprehensive income 1,971 686 2,657 2,999 683 3,682 4,146 731 4,877
Non-current assets 29,457 3,148 32,605 – 3,270 3,270
Current assets 9,633 2,477 12,110 – 2,399 2,399
Total assets 39,090 5,625 44,715 – 5,669 5,669
Current liabilities 8,527 2,114 10,641 – 2,126 2,126
Non-current liabilities 16,483 1,053 17,536 – 1,290 1,290
Total liabilities 25,010 3,167 28,177 – 3,416 3,416
Non-controlling interests 399 – 399 –––
13,681 2,458 16,139 – 2,253 2,253
Group investment in associates
Group share of net assets (as above) 13,681 2,458 16,139 – 2,253 2,253
Loans made by group companies
to associates – 497 497 – 745 745
13,681 2,955 16,636 – 2,998 2,998
aThe fair value of BP’s 19.75% stake in Rosneft was $15,937 million at 31 December 2013 based on the quoted market share price of $7.62 per share.
bBP ceased equity accounting for TNK-BP on 22 October 2012. See Note 6 for further information.
Financial statements
BP Annual Report and Form 20-F 2013 165