BP 2013 Annual Report Download - page 90
Download and view the complete annual report
Please find page 90 of the 2013 BP annual report below. You can navigate through the pages in the report by either clicking on the pages listed below, or by using the keyword search tool below to find specific information within the annual report.-
 1
1 -
2
-
3
-
4
-
5
-
6
-
7
-
8
-
9
-
10
-
11
-
12
-
13
-
14
-
15
-
16
-
17
-
18
-
19
-
20
-
21
-
22
-
23
-
24
-
25
-
26
-
27
-
28
-
29
-
30
-
31
-
32
-
33
-
34
-
35
-
36
-
37
-
38
-
39
-
40
-
41
-
42
-
43
-
44
-
45
-
46
-
47
-
48
-
49
-
50
-
51
-
52
-
53
-
54
-
55
-
56
-
57
-
58
-
59
-
60
-
61
-
62
-
63
-
64
-
65
-
66
-
67
-
68
-
69
-
70
-
71
-
72
-
73
-
74
-
75
-
76
-
77
-
78
-
79
-
 80
80 -
 81
81 -
 82
82 -
 83
83 -
 84
84 -
 85
85 -
 86
86 -
 87
87 -
 88
88 -
 89
89 -
 90
90 -
 91
91 -
 92
92 -
 93
93 -
 94
94 -
 95
95 -
 96
96 -
 97
97 -
 98
98 -
 99
99 -
 100
100 -
101
-
102
-
103
-
104
-
105
-
106
-
107
-
108
-
109
-
110
-
111
-
112
-
113
-
114
-
115
-
116
-
117
-
118
-
119
-
120
-
121
-
122
-
123
-
124
-
125
-
126
-
127
-
128
-
129
-
130
-
131
-
132
-
133
-
134
-
135
-
136
-
137
-
138
-
139
-
140
-
141
-
142
-
143
-
144
-
145
-
146
-
147
-
148
-
149
-
150
-
151
-
152
-
153
-
154
-
155
-
156
-
157
-
158
-
159
-
160
-
161
-
162
-
163
-
164
-
165
-
166
-
167
-
168
-
169
-
170
-
171
-
172
-
173
-
174
-
175
-
176
-
177
-
178
-
179
-
180
-
181
-
182
-
183
-
184
-
185
-
186
-
187
-
188
-
189
-
190
-
191
-
192
-
193
-
194
-
195
-
196
-
197
-
198
-
199
-
200
-
201
-
202
-
203
-
204
-
205
-
206
-
207
-
208
-
209
-
210
-
211
-
212
-
213
-
214
-
215
-
216
-
217
-
218
-
219
-
220
-
221
-
222
-
223
-
224
-
225
-
226
-
227
-
228
-
229
-
230
-
231
-
232
-
233
-
234
-
235
-
236
-
237
-
238
-
239
-
240
-
241
-
242
-
243
-
244
-
245
-
246
-
247
-
248
-
249
-
250
-
251
-
252
-
253
-
254
-
255
-
256
-
257
-
258
-
259
-
260
-
261
-
262
-
263
-
264
-
265
-
266
-
267
-
268
-
269
-
270
-
271
-
272
-
273
-
274
-
275
-
276
-
277
-
278
-
279
-
280
-
281
-
282
-
283
-
284
-
285
-
286
-
287
-
288
 |
 |

BP Annual Report and Form 20-F 201386
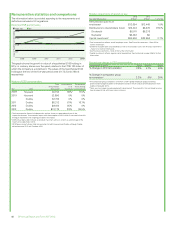
2013 outcomes
Overall group performance outcomes for the year are summarized in the
table above.
S&OR management performance, weighted at 30%, was positive.
Process safety events declined significantly to amongst the lowest of the
oil majors. Loss of primary containment did not meet its target but still
showed an improvement of more than 10% over 2012. Recordable injury
frequency continued to show marked improvement.
Performance related to value measures were similarly positive. Underlying
replacement cost profit and total cash costs both came in better than plan
targets while operating cash flow met its plan level. Major projects met plan
with one exception and Upstream unplanned deferrals exceeded target
with a 30% improvement compared to 2012. Finally, Downstream net
income per barrel was below target reflecting difficult trading conditions.
Based on these results, the group performance factor is calculated at 1.32
times target. The committee, as is its normal practice, considered this result
in the context of the underlying performance of the group, competitors’
results, shareholder feedback and input from the board and other
committees. After review, it concluded that this represented fairly the
overall performance of the business during the year and confirmed the
score for group purposes.
In the Downstream segment, safety results were good with improvement
in most areas of process and personal safety. Performance related to value
measures was negatively impacted by compression of fuel margins and so
operating cash flow was below plan level, but other operating measures
were at or better than plan. A performance score of 1.13 times target was
achieved.
Overall bonus is determined by multiplying the group score of 1.32 times
target by the on-target bonus level of 150% of salary. Bob Dudley’s total
overall bonus therefore was 198% of salary (1.32x150%). The same score
was applied to each of the other executive directors for group outcomes
resulting in both Dr Brian Gilvary and Dr Byron Grote also receiving an
overall bonus of 198% of salary. Combined with the results for his
segment (accounting for 30% of his bonus), Iain Conn’s total overall score
was 1.26 times target, resulting in a bonus of 189% of salary.
Of the total bonuses referred to above, one-third is paid in cash, one-third
is deferred on a mandatory basis, and one-third is paid either in cash or
voluntarily deferred at the individual’s election. Dr Byron Grote, who retired
mid-year, was not eligible for deferral and so his entire bonus (reflecting his
six months of service) was paid in cash.
Total remuneration in more depth
Salary and benefits
2013 outcomes
Salaries were reviewed in May 2013 using a number of internal and
external comparisons. Externally, the competitiveness of salaries and of
overall packages relative to other oil majors, other large UK and Europe-
based international companies and related US companies were
considered. Internally the committee reviewed three distinct groups – the
overall level of increases for all employees in both the UK and the US, the
distribution and average level of increases for ‘group leaders’ comprising
around 500 top executives in the company, and finally the individual and
average increases for the top executive team.
Based on this review, salaries were increased by 2.8% for Bob Dudley
(to $1,800,000), 2.9% for Iain Conn (to £774,000) and 2.9% for
Dr Brian Gilvary (to £710,000) effective 1 July 2013.
Total benefits received by executive directors included car-related benefits,
security assistance, insurance and medical benefits. The total value of
taxable benefits is included in the summary table on page 85.
2014 implementation
The remuneration committee intends to review salaries in May 2014 and
will again consider both internal and external comparisons. Benefits will
continue unchanged.
Annual bonus
Framework
All executive directors were eligible for an overall annual bonus, including
deferral, of 150% of salary at target and 225% of salary at maximum –
unchanged since 2010.
Bob Dudley’s annual bonus was based entirely on group results, as was
Dr Brian Gilvary’s and Dr Byron Grote’s. Iain Conn’s was based 70% on
group results and 30% on his Downstream segment results.
Measures and targets for the annual bonus were set at the start of the year
and were derived from the company’s annual plan which, in turn, reflected
the company’s strategy and KPIs. Measures were grouped under the
dominant themes of S&OR management, and restoring value. Targets
were set so that meeting the plan equates to on-target bonus.
At group level, S&OR was set to account for 30% of total bonus and
included targets for loss of primary containment, process safety tier 1
events and recordable injury frequency. Value measures were set to
account for 70% of total bonus and included targets for operating cash
flow, underlying replacement cost profit, total cash costs, Upstream
unplanned deferrals, major project delivery and Downstream net income
per barrel.
Additional measures and targets were set for Iain Conn’s Downstream
segment. These focused on safety, operating efficiency and profitability.
As well as the specific measures set out, the committee considers any
other results or factors it deems relevant and applies its overall judgement
in determining final bonus outcomes.
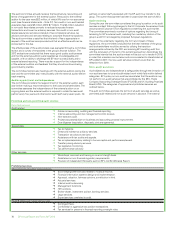
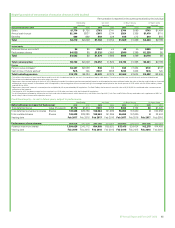
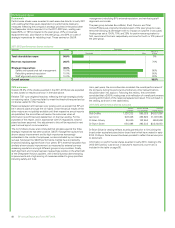
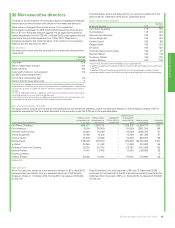
2013 annual bonus outcomes
Measures Weight
Safety and operational risk management 30.0% Threshold Target Max Result
x target
Loss of primary containment 10.0% 0.60
Process safety tier 1 events 10.0% 2.00
Recordable injury frequency 10.0% 1.55
Value 70.0% Threshold Target Max
Operating cash flow 16.3% 1.05
Underlying replacement cost profit 16.3% 1.65
Total cash costs 16.3% 1.50
Upstream unplanned deferrals 7.0% 2.00
Major project delivery 7.0% 0.50
Downstream net income per barrel 7.0% 0.68
Overall outcome 1.32