Avon 2009 Annual Report Download - page 42
Download and view the complete annual report
Please find page 42 of the 2009 Avon annual report below. You can navigate through the pages in the report by either clicking on the pages listed below, or by using the keyword search tool below to find specific information within the annual report.-
 1
1 -
2
-
3
-
4
-
5
-
6
-
7
-
8
-
9
-
10
-
11
-
12
-
13
-
14
-
15
-
16
-
17
-
18
-
19
-
20
-
21
-
22
-
23
-
24
-
25
-
26
-
27
-
28
-
29
-
30
-
31
-
 32
32 -
 33
33 -
 34
34 -
 35
35 -
 36
36 -
 37
37 -
 38
38 -
 39
39 -
 40
40 -
 41
41 -
 42
42 -
 43
43 -
 44
44 -
 45
45 -
 46
46 -
 47
47 -
 48
48 -
 49
49 -
 50
50 -
 51
51 -
 52
52 -
53
-
54
-
55
-
56
-
57
-
58
-
59
-
60
-
61
-
62
-
63
-
64
-
65
-
66
-
67
-
68
-
69
-
70
-
71
-
72
-
73
-
74
-
75
-
76
-
77
-
78
-
79
-
80
-
81
-
82
-
83
-
84
-
85
-
86
-
87
-
88
-
89
-
90
-
91
-
92
-
93
-
94
-
95
-
96
-
97
-
98
-
99
-
100
-
101
-
102
-
103
-
104
-
105
-
106
 |
 |
PART II
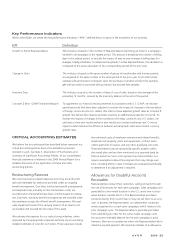
for doubtful accounts on receivable balances based on an analysis
of historical data and current circumstances, including selling
schedules, business operations, seasonality and changing trends.
Over the past three years, annual bad debt expense has been
in the range of $164 to $222, or approximately 2.0% of total
revenue.Bad debt expense, as apercent of revenueincreased by
0.3 points in 2009 as compared to 2008, caused by an influx of
new Representatives, who normally have ahigher rate of default
than established Representatives, as well as economic conditions.
The allowance for doubtful accounts is reviewed for adequacy,
at aminimum, on aquarterly basis. We generally have no
detailed information concerning, or any communication with,
any end user of our products beyond the Representative. We
have no legal recourse against the end user for the collectability
of any accounts receivable balances due from the Representative
to us. If the financial condition of our Representatives were to
deteriorate, resulting in an impairment of their ability to make
payments, additional allowances may be required.
Allowances for Sales Returns
We record aprovision for estimated sales returns based on histor-
ical experience with product returns. Over the past three years,
sales returns have been in the range of $335 to $375, or approx-
imately 3.5% of total revenue. If the historical data we use to
calculate these estimates does not approximate future returns,
due to changes in marketing or promotional strategies, or for
other reasons, additional allowances may be required.
Provisions for Inventory Obsolescence
We record an allowance for estimated obsolescence equal to
the difference between the cost of inventory and the estimated
market value. In determining the allowance for estimated
obsolescence, we classify inventory into various categories based
upon its stage in the product life cycle, future marketing sales
plans and the disposition process. We assign adegree of
obsolescence risk to products based on this classification to
determine the level of obsolescence provision. If actual sales are
less favorable than those projected by management, additional
inventory allowances may need to be recorded for such addi-
tional obsolescence. Annual obsolescence expense was $122.9
for 2009, $80.8 for 2008, and $280.6 for 2007. Obsolescence
expense for 2007 included incremental inventory obsolescence
charges of $167.3, related to our PLS program. Obsolescence
expense for 2008 benefited by approximately $13 from changes
in estimates to our disposition plan under our PLS program.
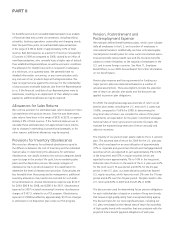
Pension, Postretirement and
Postemployment Expense
We maintain defined benefit pension plans, which cover substan-
tially all employees in the U.S. and aportion of employees in
international locations. Additionally, we have unfunded supple-
mental pension benefit plans for some current and retired execu-
tives and provide retiree health care and life insurance benefits
subject to certain limitations to the majority of employees in the
U.S. and in some foreign countries. See Note 11, Employee
Benefit Plans, to our 2009 Annual Report for further information
on our benefit plans.
Pension plan expense and the requirements for funding our
major pension plans are determined based on anumber of
actuarial assumptions. These assumptions include the expected
rate of return on pension plan assets and the discount rate
applied to pension plan obligations.
For 2009, the weighted average assumed rate of return on all
pension plan assets, including the U.S. and non-U.S. plans was
7.60%, compared to 7.66% for 2008. In determining the
long-term rates of return, we consider the nature of the plans’
investments, an expectation for the plans’ investment strategies,
historical rates of return and current economic forecasts. We
evaluate the expected long-term rate of return annually and
adjust as necessary.
The majority of our pension plan assets relate to the U.S. pension
plan. The assumed rate of return for 2009 for the U.S. plan was
8%, which was based on an asset allocation of approximately
37% in corporate and government bonds and mortgage-backed
securities (which are expected to earn approximately 4% to 6%
in the long term) and 63% in equity securities (which are
expected to earn approximately 7% to 10% in the long term).
Historical rates of return on the assets of the U.S. plan was 3.6%
for the most recent 10-year period and 8.0% for the 20-year
period. In the U.S. plan, our asset allocation policy has favored
U.S. equity securities, which have returned .3% over the 10-year
period and 8.4% over the 20-year period. The plan assets in the
U.S. returned 24.6% in 2009 and lost 26.2% in 2008.
The discount rate used for determining future pension obligations
for each individual plan is based on areview of long-term bonds
that receive ahigh-quality rating from arecognized rating agency.
The discount rates forour more significant plans, including our
U.S. plan, were based on the internal rates of return for aportfolio
of high quality bonds with maturities that are consistent with the
projected future benefit payment obligations of each plan.