Avon 2009 Annual Report Download - page 100
Download and view the complete annual report
Please find page 100 of the 2009 Avon annual report below. You can navigate through the pages in the report by either clicking on the pages listed below, or by using the keyword search tool below to find specific information within the annual report.-
 1
1 -
2
-
3
-
4
-
5
-
6
-
7
-
8
-
9
-
10
-
11
-
12
-
13
-
14
-
15
-
16
-
17
-
18
-
19
-
20
-
21
-
22
-
23
-
24
-
25
-
26
-
27
-
28
-
29
-
30
-
31
-
32
-
33
-
34
-
35
-
36
-
37
-
38
-
39
-
40
-
41
-
42
-
43
-
44
-
45
-
46
-
47
-
48
-
49
-
50
-
51
-
52
-
53
-
54
-
55
-
56
-
57
-
58
-
59
-
60
-
61
-
62
-
63
-
64
-
65
-
66
-
67
-
68
-
69
-
70
-
71
-
72
-
73
-
74
-
75
-
76
-
77
-
78
-
79
-
80
-
81
-
82
-
83
-
84
-
85
-
86
-
87
-
88
-
89
-
 90
90 -
 91
91 -
 92
92 -
 93
93 -
 94
94 -
 95
95 -
 96
96 -
 97
97 -
 98
98 -
 99
99 -
 100
100 -
 101
101 -
 102
102 -
 103
103 -
 104
104 -
 105
105 -
 106
106
 |
 |

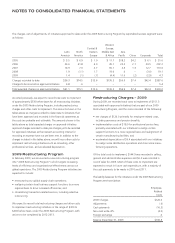
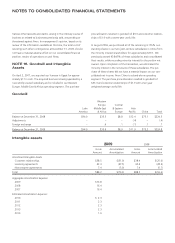
NOTES TO CONSOLIDATED FINANCIAL STATEMENTS
NOTE 18. Results of Operations by Quarter (Unaudited)
2009 First Second Third Fourth Year
Total revenue $2,179.8 $2,470.3 $2,551.3 $3,181.4 $10,382.8
Gross profit 1,368.6 1,536.0 1,596.5 1,993.4 6,494.5
Operating profit 168.4 182.9 258.5 408.4 1,018.2
Income before taxes 146.7 159.9 231.7 388.2 926.5
Net income 117.5 84.6 157.6 268.5 628.2
Net income attributable to Avon 117.3 82.9 156.2 269.4 625.8
Earnings per share
Basic $.27 $.19 $.36 $.63 $1.45(1)
Diluted $.27 $.19 $.36 $.62 $1.45(1)
2008 First Second Third Fourth Year
Total revenue $2,501.7 $2,736.1 $2,644.7 $2,807.6 $10,690.1
Gross profit 1,578.0 1,742.7 1,669.7 1,750.6 6,741.0
Operating profit 296.2 373.9 297.1 372.1 1,339.3
Income before taxes 278.6 344.4 279.2 336.1 1,238.3
Net income 186.2 237.0 224.7 227.7 875.6
Net income attributable to Avon 184.7 235.6 222.6 232.4 875.3
Earnings per share
Basic $.43 $.55 $.52 $.54 $2.04(1)
Diluted $.43 $.55 $.52 $.54 $2.03(1)
(1) The sum of per share amounts for the quarters does not necessarily equal that for the year because the computations were made independently.
Results of operations by quarter were impacted by the following:
2009 First Second Third Fourth Year
Costs to implement restructuring initiatives:
Cost of sales $– $.3$3.3 $3.1 $6.7
Selling, general and administrative expenses 14.5 89.1 30.2 30.9 164.7
Total costs to implement restructuring initiatives $14.5 $89.4 $33.5 $34.0 $171.4
2008 First Second Third Fourth Year
Costs to implement restructuring initiatives:
Cost of sales $– $.3$2.6 $.2$3.1
Selling, general and administrative expenses 25.5 13.0 11.8 7.2 57.5
Total costs to implement restructuring initiatives $25.5 $13.3 $14.4 $7.4 $60.6
Benefits related to our PLS program $– $(13.0) $– $– $(13.0)
NOTE 19. Subsequent Events
Management evaluated subsequent events through February 25,
2010, which is the date the financial statements were issued.
Effective January 1, 2010, Avon will treat Venezuela as ahighly
inflationary economy for accounting purposes. Effective Jan-
uary 11, 2010, the Venezuelan government devalued its cur-
rency and moved to atwo-tier exchange structure. The official
exchange rate moved from 2.15 to 2.60 for essential goods and
to 4.30 for non-essential goods and services. Although no offi-
cial rules have yet been issued, most of Avon’s imports are
expected to fall into the non-essential classification.
On February 9, 2010, we announced an increase in our quarterly
cash dividend to $.22 per share from $.21 per share, beginning
with the first-quarter dividend payable March 1, 2010, to share-
holders of record on February 23, 2010. With this increase, the
indicated annual dividend rate is $.88 per share.