Avon 2009 Annual Report Download - page 34
Download and view the complete annual report
Please find page 34 of the 2009 Avon annual report below. You can navigate through the pages in the report by either clicking on the pages listed below, or by using the keyword search tool below to find specific information within the annual report.-
 1
1 -
2
-
3
-
4
-
5
-
6
-
7
-
8
-
9
-
10
-
11
-
12
-
13
-
14
-
15
-
16
-
17
-
18
-
19
-
20
-
21
-
22
-
23
-
 24
24 -
 25
25 -
 26
26 -
 27
27 -
 28
28 -
 29
29 -
 30
30 -
 31
31 -
 32
32 -
 33
33 -
 34
34 -
 35
35 -
 36
36 -
 37
37 -
 38
38 -
 39
39 -
 40
40 -
 41
41 -
 42
42 -
 43
43 -
 44
44 -
45
-
46
-
47
-
48
-
49
-
50
-
51
-
52
-
53
-
54
-
55
-
56
-
57
-
58
-
59
-
60
-
61
-
62
-
63
-
64
-
65
-
66
-
67
-
68
-
69
-
70
-
71
-
72
-
73
-
74
-
75
-
76
-
77
-
78
-
79
-
80
-
81
-
82
-
83
-
84
-
85
-
86
-
87
-
88
-
89
-
90
-
91
-
92
-
93
-
94
-
95
-
96
-
97
-
98
-
99
-
100
-
101
-
102
-
103
-
104
-
105
-
106
 |
 |

PART II
ITEM 5. MARKET FOR REGISTRANT’S COMMON EQUITY, RELATED STOCKHOLDER
MATTERS AND ISSUER PURCHASES OF EQUITY SECURITIES
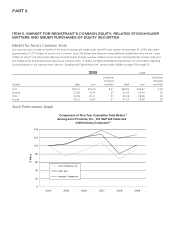
Market for Avon’s Common Stock
Our common stock is listed on the New York Stock Exchange and trades under the AVP ticker symbol. At December 31, 2009, there were
approximately 17,277 holders of record of our common stock. We believe that there are many additional shareholders who are not “share-
holders of record” but who beneficially own and vote shares through nominee holders such as brokers and benefit plan trustees. High and
low market prices and dividends per share of our common stock, in dollars, for 2009 and 2008 are listed below. For information regarding
future dividends on our common stock, see the “Liquidity and Capital Resources” section within MD&A on pages 33 through 36.
2009 2008
Quarter High Low
Dividends
Declared
and Paid High Low
Dividends
Declared
and Paid
First $25.10 $15.20 $.21 $40.50 $34.47 $.20
Second 27.59 19.37 .21 41.05 35.44 .20
Third 33.96 25.11 .21 45.25 35.08 .20
Fourth 36.12 31.45 .21 41.23 18.38 .20
Stock Performance Graph
Comparison of Five-Year Cumulative Total Return
Among Avon Products, Inc., The S&P 500 Index and
2009 Industry Composite
(1)
(2)
0
20
40
60
80
100
120
140
2004 2005 2006 2007 2008 2009
$ Value
Avon Products, Inc.
S&P 500
Industry Composite