Avon 2005 Annual Report Download - page 56
Download and view the complete annual report
Please find page 56 of the 2005 Avon annual report below. You can navigate through the pages in the report by either clicking on the pages listed below, or by using the keyword search tool below to find specific information within the annual report.-
 1
1 -
2
-
3
-
4
-
5
-
6
-
7
-
8
-
9
-
10
-
11
-
12
-
13
-
14
-
15
-
16
-
17
-
18
-
19
-
20
-
21
-
22
-
23
-
24
-
25
-
26
-
27
-
28
-
29
-
30
-
31
-
32
-
33
-
34
-
35
-
36
-
37
-
38
-
39
-
40
-
41
-
42
-
43
-
44
-
45
-
 46
46 -
 47
47 -
 48
48 -
 49
49 -
 50
50 -
 51
51 -
 52
52 -
 53
53 -
 54
54 -
 55
55 -
 56
56 -
 57
57
 |
 |

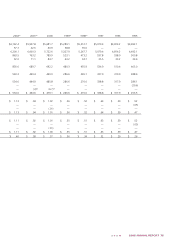
ELEVEN-YEARREVIEW
In millions, except per share and employee data 2005(2) 2004 2003 2002(3) 2001(4) 2000 1999(5) 1998(5) 1997 1996 1995
Balance sheet data
Working capital $ 419.3 $ 896.9 $ 619.1 $ 72.7 $ 428.1 $ 186.4 $ (375.0) $ 11.9 $ (11.9) $ (41.7) $ (30.3)
Capital expenditures 206.8 250.1 162.6 126.5 155.3 193.5 200.2 189.5 169.4 103.6 72.7
Property, plant and equipment, net 1,050.8 1,014.8 855.6 769.1 771.7 765.7 732.1 669.9 611.0 566.6 537.8
Total assets 4,763.3 4,148.1 3,562.3 3,327.5 3,181.0 2,811.3 2,512.8 2,433.5 2,272.9 2,222.4 2,052.8
Debt maturing within one year 882.5 51.7 244.1 605.2 88.8 105.4 306.0 55.3 132.1 97.1 47.3
Long-term debt 766.5 866.3 877.7 767.0 1,236.3 1,108.2 701.4 201.0 102.2 104.5 114.2
Total debt 1,649.0 918.0 1,121.8 1,372.2 1,325.1 1,213.6 1,007.4 256.3 234.3 201.6 161.5
Shareholders’ equity (deficit) 794.2 950.2 371.3 (127.7) (75.1) (230.9) (421.9) 285.1 285.0 241.7 192.7
Number of employees
United States 8,700 8,900 9,400 9,200 9,600 9,800 9,700 8,000 8,100 7,800 8,000
International 40,300 38,800 36,500 36,100 34,200 33,200 30,800 25,900 26,900 25,900 23,800
Total employees(9) 49,000 47,700 45,900 45,300 43,800 43,000 40,500 33,900 35,000 33,700 31,800
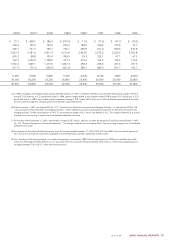
(1) For the year ended December 31, 2000, we adopted the provisions of Emerging Issues Task Force (“EITF”) 00-10, “Accounting for Shipping and
Handling Fees and Costs,” which requires that amounts billed to customers for shipping and handling fees be classified as revenues. 1999 and 1998
have been restated to reflect shipping and handling fees, previously reported in marketing, distribution and administrative expenses, in other revenue
in the Consolidated Statements of Income. 1995 through 1997 has not been restated.
(2) In 2005, we recorded restructuring charges and other costs to implement the restructuring initiatives totaling $56.5 pretax ($44.2 after tax, or $.09
per diluted share), related to our multi-year restructuring plan announced during 2005.
(3) In 2002, we recorded restructuring charges of $43.6 pretax ($30.4 after tax, or $.06 per diluted share), primarily related to workforce reductions and
facility rationalizations. We also reversed $7.3 pretax ($5.2 after tax, or $.01 per diluted share).
(4) In 2001, we recorded restructuring charges of $97.4 pretax ($68.3 after tax, or $.14 per diluted share), primarily related to workforce reductions and
facility rationalizations. In 2001, we also received a cash settlement, net of related expenses, of $25.9 pretax ($15.7 after tax, or $.03 per diluted
share) to compensate Avon for lost profits and incremental expenses as a result of the cancellation of a retail agreement with Sears.