Avon 2005 Annual Report Download - page 10
Download and view the complete annual report
Please find page 10 of the 2005 Avon annual report below. You can navigate through the pages in the report by either clicking on the pages listed below, or by using the keyword search tool below to find specific information within the annual report.-
 1
1 -
 2
2 -
 3
3 -
 4
4 -
 5
5 -
 6
6 -
 7
7 -
 8
8 -
 9
9 -
 10
10 -
 11
11 -
 12
12 -
 13
13 -
 14
14 -
 15
15 -
 16
16 -
 17
17 -
 18
18 -
 19
19 -
 20
20 -
 21
21 -
22
-
23
-
24
-
25
-
26
-
27
-
28
-
29
-
30
-
31
-
32
-
33
-
34
-
35
-
36
-
37
-
38
-
39
-
40
-
41
-
42
-
43
-
44
-
45
-
46
-
47
-
48
-
49
-
50
-
51
-
52
-
53
-
54
-
55
-
56
-
57
 |
 |

MANAGEMENT’SDISCUSSIONANDANALYSIS
OFFINANCIALCONDITIONANDRESULTSOFOPERATIONS
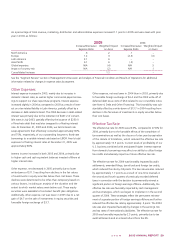
SEGMENTREVIEW
Below is an analysis of the key factors affecting revenue and operating profit by reportable segment for each of the years in the three-year
period ended December 31, 2005.
Years ended December 31 2005 2004 2003
Total Operating Total Operating Total Operating
Revenue Profit Revenue Profit Revenue Profit
North America
U.S. $2,140.7 $314.6 $2,287.6 $ 377.2 $2,262.2 $ 420.9
Other* 369.8 38.9 344.7 34.2 312.3 5.0
Total 2,510.5 353.5 2,632.3 411.4 2,574.5 425.9
International
Europe 2,291.4 458.9 2,102.2 471.7 1,613.1 313.4
Latin America 2,272.6 516.0 1,934.6 479.1 1,717.9 406.3
Asia Pacific 1,075.1 141.5 1,078.7 192.7 939.6 156.6
Total 5,639.1 1,116.4 5,115.5 1,143.5 4,270.6 876.3
Total from operations 8,149.6 1,469.9 7,747.8 1,554.9 6,845.1 1,302.2
Global expenses** – (320.9) – (325.9) – (259.4)
Total $8,149.6 $1,149.0 $7,747.8 $1,229.0 $6,845.1 $1,042.8
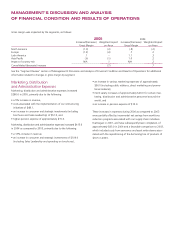
** Includes Canada, Puerto Rico, Dominican Republic, Avon Salon and Spa and U.S. Retail (see Note 16, Other Information).
** Global expenses include, among other things, costs related to our executive and administrative offices, information technology, research and development, and
marketing. Global expenses in 2004 and 2003 included benefits of $3.2 and $3.9, respectively, related to releases of 2001 and 2002 restructuring reserves.
Restructuring charges recorded in 2005 were reflected in the respective segment’s operating profit.
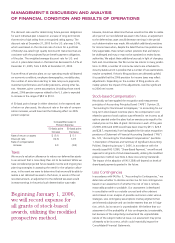
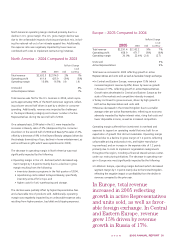
As discussed previously, we announced changes to our global
operating structure in December 2005. Effective January 1, 2006,
we began managing Central and Eastern Europe and also China
as stand-alone operating segments. These changes increase
the number of our reportable segments to six: North America;
Western Europe, Middle East and Africa; Central and Eastern
Europe; Latin America; Asia Pacific; and China.
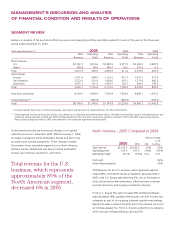
North America – 2005 Compared to 2004
%/Point Change
Local
2005 2004 US$ Currency
Total revenue $2,510.5 $2,632.3 (5)% (5)%
Operating profit 353.5 411.4 (14)% (15)%
Operating margin 14.1% 15.6% (1.5) (1.5)
Units sold (6)%
Active Representatives (3)%
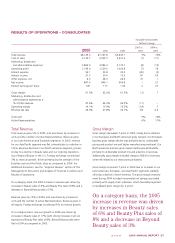
Total Revenue for the U.S. business, which represents approxi-
mately 85% of the North American segment, decreased 6% in
2005, with U.S. Beauty sales declining 9%, due to decreases in
units sold and active Representatives, reflecting lower customer
purchase frequency and ongoing competitive intensity.
In the U.S., Beauty Plus sales increased 8% and Beyond Beauty
sales decreased 18%, partially reflecting the mix shift in these two
categories as part of our ongoing, planned repositioning strategy.
Beauty Plus sales increased primarily due to the national roll-out of
an intimate apparel line. The U.S. business exited the toy category,
which was part of Beyond Beauty, during 2005.
Total revenue for the U.S.
business, which represents
approximately 85% of the
North American segment,
decreased 6% in 2005.