Avon 2005 Annual Report Download - page 12
Download and view the complete annual report
Please find page 12 of the 2005 Avon annual report below. You can navigate through the pages in the report by either clicking on the pages listed below, or by using the keyword search tool below to find specific information within the annual report.-
 1
1 -
 2
2 -
 3
3 -
 4
4 -
 5
5 -
 6
6 -
 7
7 -
 8
8 -
 9
9 -
 10
10 -
 11
11 -
 12
12 -
 13
13 -
 14
14 -
 15
15 -
 16
16 -
 17
17 -
 18
18 -
 19
19 -
 20
20 -
 21
21 -
 22
22 -
23
-
24
-
25
-
26
-
27
-
28
-
29
-
30
-
31
-
32
-
33
-
34
-
35
-
36
-
37
-
38
-
39
-
40
-
41
-
42
-
43
-
44
-
45
-
46
-
47
-
48
-
49
-
50
-
51
-
52
-
53
-
54
-
55
-
56
-
57
 |
 |

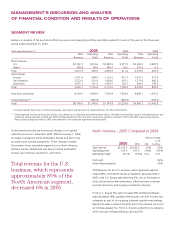
MANAGEMENT’SDISCUSSIONANDANALYSIS
OFFINANCIALCONDITIONANDRESULTSOFOPERATIONS
• Operating costs associated with Europe’s manufacturing loca-
tions increased (which reduced segment margin by .8 point),
primarily due to higher manufacturing overhead.
• Costs associated with planning and developing an enterprise
resource planning system negatively impacted operating margin
(which reduced segment margin by .7 point).
• In Central and Eastern Europe, operating margin declined
(which reduced segment margin by .6 point), primarily due to
a decline in Russia. Russia’s gross margin declined mainly due
to unfavorable pricing and product mix and adverse foreign
exchange movements.
• Operating margin was positively impacted by greater contribu-
tions from countries with higher operating margins (which
increased segment margin by .7 point), primarily driven by
revenue growth in the high margin Central and Eastern Europe
markets and Turkey.
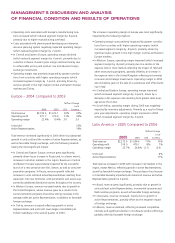
Europe – 2004 Compared to 2003
%/Point Change
Local
2004 2003 US$ Currency
Total revenue $2,102.2 $1,613.1 30% 20%
Operating profit 471.7 313.4 51% 39%
Operating margin 22.4% 19.4% 3.0 3.0
Units sold 22%
Active Representatives 16%
Total revenue increased significantly in 2004 driven by substantial
growth in units sold and the number of active Representatives, as
well as favorable foreign exchange, with the following markets
having the most significant impact:
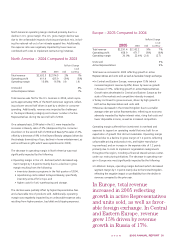
• In Central and Eastern Europe, revenue grew significantly,
primarily driven by an increase in Russia and, to a lesser extent,
increases in all other markets in the region. Revenue in Central
and Eastern Europe was positively impacted by the successful
launch of a new personal care line, Senses, as well as consumer
promotion programs. In Russia, revenue growth reflected
increases in units sold and active Representatives resulting from
expansion into new territories, with penetration and access sup-
ported by additional distribution points throughout the country.
• In Western Europe, revenue increased mainly due to growth in
the United Kingdom, where revenue grew as a result of con-
sumer promotion programs that drove strong increases in the
average order per active Representative, in addition to favorable
foreign exchange.
• In Turkey, revenue increased reflecting growth in active
Representatives and units sold. Avon began consolidating its
Turkish subsidiary in the second quarter of 2003.
The increase in operating margin in Europe was most significantly
impacted by the following markets:
• Operating margin was positively impacted by greater contribu-
tions from countries with higher operating margins (which
increased segment margin by .8 point), primarily driven by
significant sales growth in the high margin Central and Eastern
Europe markets.
• In Western Europe, operating margin improved (which increased
segment margin by .8 point) primarily due to a decline in the
expense ratio in most markets reflecting the impact of field and
other restructuring programs, partially offset by an increase in
the expense ratio in the United Kingdom reflecting incremental
consumer and strategic investments. Operating margin in 2004
also included a gain on the sale of a warehouse and office build-
ing in Italy.
• In Central and Eastern Europe, operating margin improved
(which increased segment margin by .6 point), driven by a
decrease in the expense ratio resulting from greater sales lever-
age across the cluster.
• In South Africa, operating margin during 2003 was negatively
impacted by inventory adjustments. Primarily as a result of these
prior year adjustments, operating margin improved in 2004
(which increased segment margin by .4 point).
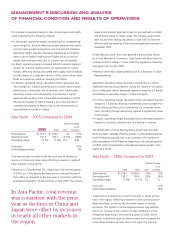
Latin America – 2005 Compared to 2004
%/Point Change
Local
2005 2004 US$ Currency
Total revenue $2,272.6 $1,934.6 17% 10%
Operating profit 516.0 479.1 8% 1%
Operating margin 22.7% 24.8% (2.1) (2.0)
Units sold 8%
Active Representatives 11%
Total revenue increased in 2005 with increases in all markets in the
region, except Mexico, reflecting growth in active Representatives,
as well as favorable foreign exchange. The purchase of our licensee
in Colombia favorably impacted Latin America’s revenue and active
Representative growth by 2 points.
• In Brazil, revenue grew significantly, primarily due to growth in
units sold and active Representatives, incremental consumer and
field incentive programs, as well as favorable foreign exchange.
• In Venezuela, revenue increased, mainly due to growth in
active Representatives, partially offset by the negative impact
of foreign exchange.
• In Mexico, revenue declined, reflecting increased competitive
intensity and significant decline in non-Beauty product offerings,
partially offset by favorable foreign exchange.