Avnet 2012 Annual Report Download - page 6
Download and view the complete annual report
Please find page 6 of the 2012 Avnet annual report below. You can navigate through the pages in the report by either clicking on the pages listed below, or by using the keyword search tool below to find specific information within the annual report.-
 1
1 -
 2
2 -
 3
3 -
 4
4 -
 5
5 -
 6
6 -
 7
7 -
 8
8 -
 9
9 -
 10
10 -
 11
11 -
 12
12 -
 13
13 -
 14
14 -
 15
15 -
 16
16 -
 17
17 -
18
-
19
-
20
-
21
-
22
-
23
-
24
-
25
-
26
-
27
-
28
-
29
-
30
-
31
-
32
-
33
-
34
-
35
-
36
-
37
-
38
-
39
-
40
-
41
-
42
-
43
-
44
-
45
-
46
-
47
-
48
-
49
-
50
-
51
-
52
-
53
-
54
-
55
-
56
-
57
-
58
-
59
-
60
-
61
-
62
-
63
-
64
-
65
-
66
-
67
-
68
-
69
-
70
-
71
-
72
-
73
-
74
-
75
-
76
-
77
-
78
-
79
-
80
-
81
-
82
-
83
-
84
-
85
-
86
-
87
-
88
-
89
-
90
-
91
-
92
-
93
-
94
-
95
-
96
-
97
-
98
-
99
-
100
-
101
-
102
-
103
-
104
-
105
-
106
-
107
-
108
-
109
-
110
-
111
-
112
-
113
-
114
-
115
-
116
-
117
-
118
-
119
-
120
-
121
-
122
-
123
-
124
-
125
-
126
-
127
-
128
-
129
-
130
-
131
-
132
-
133
-
134
-
135
-
136
-
137
-
138
-
139
-
140
 |
 |

Table of Contents
In EMEA and Asia/Pacific, TS also provides the latest hard disk drives, microprocessor, motherboard and DRAM module technologies to
manufacturers of general-purpose computers and system builders.
Foreign Operations
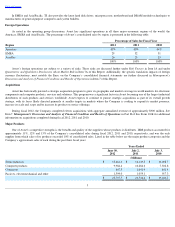
As noted in the operating group discussions, Avnet has significant operations in all three major economic regions of the world: the
Americas, EMEA and Asia/Pacific. The percentage of Avnet’s consolidated sales by region is presented in the following table:
Avnet’s foreign operations are subject to a variety of risks. These risks are discussed further under Risk Factors
in Item 1A and under
Quantitative and Qualitative Disclosures About Market Risk
in Item 7A of this Report. Additionally, the specific translation impacts of foreign
currency fluctuations, most notably the Euro, on the Company’s consolidated financial statements are further discussed in Management’
s
Discussion and Analysis of Financial Condition and Results of Operations
in Item 7 of this Report.
Acquisitions
Avnet has historically pursued a strategic acquisition program to grow its geographic and market coverage in world markets for electronic
components and computer products, services and solutions. This program was a significant factor in Avnet becoming one of the largest industrial
distributors of such products and services worldwide. Avnet expects to continue to pursue strategic acquisitions as part of its overall growth
strategy, with its focus likely directed primarily at smaller targets in markets where the Company is seeking to expand its market presence,
increase its scale and scope and/or increase its product or service offerings.
During fiscal 2012, the Company completed eleven acquisitions with aggregate annualized revenue of approximately $900 million. See
Item 7. Management’s Discussion and Analysis of Financial Condition and Results of Operations in Part II of this Form 10-
K for additional
information on acquisitions completed during fiscal 2012, 2011 and 2010.
Major Products
One of Avnet’
s competitive strengths is the breadth and quality of the suppliers whose products it distributes. IBM products accounted for
approximately 11%, 12% and 15% of the Company’
s consolidated sales during fiscal 2012, 2011 and 2010, respectively, and was the only
supplier from which sales of its products exceeded 10% of consolidated sales. Listed in the table below are the major product categories and the
Company’s approximate sales of each during the past three fiscal years:
5
Percentage of Sales for Fiscal Year
Region 2012
2011
2010
Americas 45%
43%
44%
EMEA 29
32
31
Asia/Pac 26
25
25
100%
100%
100%
Years Ended
June 30,
2012
July 2,
2011
July 3,
2010
(Millions)
Semiconductors
$
13,461.6
$
14,149.3
$
10,098.7
Computer products
9,984.4
10,284.6
7,302.8
Connectors
667.5
1,041.4
841.4
Passives, electromechanical and other
1,594.0
1,059.1
917.3
$
25,707.5
$
26,534.4
$
19,160.2