Avnet 2009 Annual Report Download - page 20
Download and view the complete annual report
Please find page 20 of the 2009 Avnet annual report below. You can navigate through the pages in the report by either clicking on the pages listed below, or by using the keyword search tool below to find specific information within the annual report.
Table of Contents
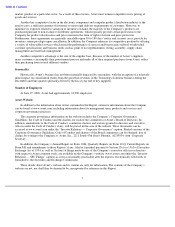
Results of Operations
Executive Summary
During fiscal year 2009, the Company’s financial results were adversely impacted by the global economic
slowdown as year-over-year sales declined by just over 9% and organic sales declined by over 15%. However, there
are indications that the current economic environment may be stabilizing as sequential sales in the June quarter were
essentially flat, excluding the impact of foreign currency exchange rate changes. Gross profit margins declined
43 basis points year over year primarily due to business mix changes in EM and market conditions. As a result of the
write down of goodwill and intangible assets, the Company incurred an operating loss of just over $1 billion
compared to operating income of $710 million in fiscal 2008. Excluding impairment charges, operating income
margins declined 155 basis points. As the challenging economic environment accelerated during the fiscal year,
demand continued to weaken in both operating groups and, in response, the Company took actions to continue to
reduce costs over the course of the fiscal year to better align its cost structure with the market conditions.
Approximately 90% of the total of $225 million in annualized cost savings had been achieved through the end of the
fiscal 2009, with the remaining actions expected to be completed by the end of the first quarter of fiscal 2010. In
addition, the Company expects to achieve cost synergies of approximately $40 million as a result of acquisition
integration activities most of which were completed by the end of fiscal 2009 with the remaining expected to be
completed by the end of the second quarter of fiscal 2010.
The Company continued to focus on managing working capital, defined as receivables plus inventory less
accounts payable, which declined 30% year over year and contributed to the generation of over $1 billion in cash
from operating activities as compared with $454 million in fiscal 2008. However, as revenues seem to be stabilizing
and working capital velocity are at appropriate levels for the operating groups, management does not expect to
continue to generate the same levels of cash from operating activities as were generated in fiscal 2009.
During fiscal 2009, the Company invested in five acquisitions (see table in the Sales section) and expects to
continue to make strategic investments through acquisition activity to the extent the investments strengthen Avnet’s
competitive position and meet management’s return on capital requirements.
Sales
The table below provides a year-over-year summary of sales for the Company and its operating groups:
Three-Year Analysis of Sales: By Operating Group and Geography
17
Years Ended
Percent Change
June 27,
% of
June 28,
% of
June 30,
% of
2009 to
2008 to
2009
Total
2008
Total
2007
Total
2008
2007
(Dollars in millions)
Sales by Operating Group:
EM Americas
$
3,288.3
20.3
%
$
3,771.9
21.0
%
$
3,722.7
23.7
%
(12.8
)%
1.3
%
EM EMEA
3,026.5
18.6
3,631.8
20.2
3,306.3
21.1
(16.7
)
9.8
EM Asia
2,878.0
17.7
2,923.1
16.3
2,650.8
16.9
(1.6
)
10.3
Total EM
9,192.8
56.6
10,326.8
57.5
9,679.8
6
1.7
(11.0
)
6.7
TS Americas
4,283.9
26.4
4,806.6
26.8
4,103.5
26.2
(10.9
)
17.1
TS EMEA
2,241.9
13.8
2,327.0
13.0
1,579.4
10.1
(3.7
)
47.3
TS Asia
511.3
3.2
492.3
2.7
318.4
2.0
3.9
54.6
Total TS
7,037.1
43.4
7,625.9
42.5
6,001.3
38.3
(7.7
)
27.1
Total Avnet, Inc.
$
16,229.9
$
17,952.7
$
15,681.1
(9.6
)%
14.5
%
Sales by Geographic Area:
Americas
$
7,572.2
46.7
%
$
8,578.5
47.8
%
$
7,826.2
49.9
%
(11.7
)%
9.6
%
EMEA
5,268.4
32.4
5,958.8
33.2
4,885.7
31.2
(11.6
)
22.0
Asia/Pacific
3,389.3
20.9
3,415.4
19.0
2,969.2
18.9
(0.8
)
15.0
$
16,229.9
$
17,952.7
$
15,681.1


