Atmos Energy 2005 Annual Report Download - page 3
Download and view the complete annual report
Please find page 3 of the 2005 Atmos Energy annual report below. You can navigate through the pages in the report by either clicking on the pages listed below, or by using the keyword search tool below to find specific information within the annual report.-
 1
1 -
 2
2 -
 3
3 -
 4
4 -
 5
5 -
 6
6 -
 7
7 -
 8
8 -
 9
9 -
 10
10 -
 11
11 -
 12
12 -
 13
13 -
 14
14 -
15
-
16
-
17
-
18
 |
 |

2 3
f i n a n c i a l h i g h l i g h t s l e t t e r t o s h a r e h o l d e r s
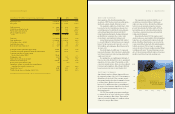
YEARENDEDSEPTEMBER30(Dollarsinthousands,exceptpersharedata) 2 0 0 5 2 0 0 4 C h a n g e
Operatingrevenues $4,973,326 $ 2,920,037 70.3%
Grossprofit $1,129,090 $ 562,191 100.8%
Utilitynetincome $81,117 $ 63,096 28.6%
Naturalgasmarketingnetincome 23,404 16,633 40.7%
Pipelineandstoragenetincome 30,599 2,767 1,005.9%
Othernonutilitynetincome 665 3,731 -82.2%
Total $135,785 $ 86,227 57.5%
Totalassets $5,653,527 $ 2,912,627 94.1%
Totalcapitalization* $3,785,526 $ 1,994,770 89.8%
Netincomepershare–diluted $1.72 $ 1.58 8.9%
Cashdividendspershare $1.24 $ 1.22 1.6%
Bookvaluepershareatendofyear $19.90 $ 18.05 10.2%
Consolidatedutilitysegmentthroughput(MMcf) 411,134 246,033 67.1%
Consolidatednaturalgasmarketingsegmentthroughput(MMcf) 238,097 222,572 7.0%
Consolidatedpipelineandstoragesegment
transportationvolumes(MMcf) 375,604 — —
Heatingdegreedays 2,587 3,271 -20.9%
Degreedaysasapercentageofnormal 89% 96% -7.3%
Metersinserviceatendofyear 3,157,840 1,679,136 88.1%
Returnonaverageshareholders’equity 9.0% 9.1% -1.1%
Shareholders’equityasapercentageoftotalcapitalization
(includingshort-termdebt)atendofyear 40.7% 56.7% -28.2%
Shareholdersofrecord 26,242 27,555 -4.8%
Weightedaveragesharesoutstanding–diluted(000s) 79,012 54,416 45.2%
*Totalcapitalizationrepresentsthesumofshareholders’equityandlong-termdebt(excludingcurrentmaturities).
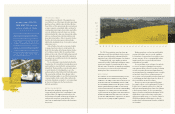
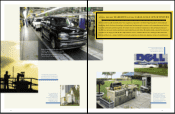
D E A R F E L L O W S H A R E H O L D E R :
Ouracquisitionofthedistributionandpipeline
operationsofTXUGashascreatedapowerfulunion—
whichisthesubjectofmuchofthisyear’sreport.
Theacquisition,whichclosedonOctober1,2004,
hasexceededourbestexpectations,asmeasuredon
severaldimensions.ItcontributedtoAtmosEnergy’s
extraordinaryfinancialresultsinfiscal2005.It
transformedAtmosEnergyintothelargestall-natural-
gasdistributioncompanyinthecountry,andit
createdmajoropportunitiesforfuturegrowth.
AtmosEnergy’sgrossprofitinfiscal2005doubled
toexceed$1billionforthefirsttimeinourcompany’s
history.Netincomeincreased58percenttoarecord
$135.8million,andearningsperdilutedsharegrewby
14centsto$1.72.
Fiscal2005markedourfifthyearofconsistently
improvedperformance.Ourtotalreturntoshareholders
was17.2percent,andourreturnonaverageshareholders’
equitywas9.0percent.
Recognizingtheseaccomplishments,theBoardof
Directorsraisedthedividendby2centstoanindicated
annualrateof$1.26pershare.Thismarkedour18th
consecutiveannualincrease.Moreover,whenadjusted
formergersandacquisitions,AtmosEnergy’sdividend
hasgoneupeveryyearsinceitwasformedin1983.
E X C E P T I O N A L P E R F O R M A N C E
AtmosEnergy’semployeesdidmorethanjustdeliveron
thecompany’spromiseof$1.65to$1.75inearningsper
dilutedshareforfiscal2005.Theyovercamewarmer-
than-normalweatherthatreducedearningsby29cents
perdilutedshare,dilutionfromayear-over-year
increaseof24.6millionmoresharesoutstandingand
theravagesoftwohurricanesthataffectedtwo-thirds
ofourLouisianaoperationsandaportionofour
Mississippiterritory.
TheTXUGasacquisitionwasamajorcontributor
toearnings.Itwasaccretiveinthefirstyear—adding
18centstoearningsperdilutedshare.Thatresultfar
surpassedouroriginalestimateofacontributionfrom
5centsto10centsperdilutedshare.
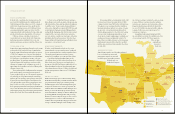
Theacquisitionhasnearlydoubledthesizeof
ourutilityoperationsbyadding1.5milliongas
utilitycustomersinTexas.Overall,theadditional
territoryexceedsnationalaveragesforcustomer
growth.Inparticular,theDallasandFortWorth
metropolitanareasaswellasthenorthernsuburbs
ofAustinareexperiencingstrongresidentialand
commercialdevelopment.
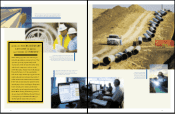
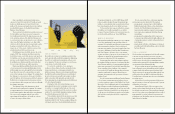
IntegratingtheformerTXUGasemployeesand
operationshasgoneexceptionallywell.Ourintegration
teamshaveexceededgoalsandcompletedworkwell
aheadofdeadlines.Inparticular,weareproudofthe
conversionofalltheformerback-officeandinformation
technologysystems.Wenolongerareusingany
outsourcedservicesformeterreading,customerbilling
ortelephonecallcenters.Weexpectthatusingourown
state-of-the-artsystemswillleadtoimprovedcustomer
satisfactionandlowerlong-termoperatingcosts.
$1.72
$1.58
$1.54
$1.47 $1.45
$1.80
1.50
1.20
0.90
0.60
2001 2002 2003 2004 2005
E a r n i n g s R e v i e w
Netincomeperdilutedshare