Atmos Energy 2005 Annual Report Download - page 13
Download and view the complete annual report
Please find page 13 of the 2005 Atmos Energy annual report below. You can navigate through the pages in the report by either clicking on the pages listed below, or by using the keyword search tool below to find specific information within the annual report.-
 1
1 -
2
-
 3
3 -
 4
4 -
 5
5 -
 6
6 -
 7
7 -
 8
8 -
 9
9 -
 10
10 -
 11
11 -
 12
12 -
 13
13 -
 14
14 -
 15
15 -
 16
16 -
 17
17 -
 18
18
 |
 |

2 2 2 3
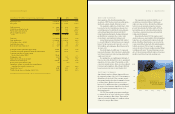
c o n d e n s e d c o n s o l i d a t e d b a l a n c e s h e e t s c o n d e n s e d c o n s o l i d a t e d s t a t e m e n t s o f i n c o m e
SEPTEMBER30(Dollarsinthousands,exceptsharedata) 2 0 0 5 2 0 0 4
Assets
Property,plantandequipment $4,631,684$ 2,595,374
Constructioninprogress 133,926 38,277
4,765,610 2,633,651
Lessaccumulateddepreciationandamortization 1,391,243 911,130
Netproperty,plantandequipment 3,374,367 1,722,521
Currentassets
Cashandcashequivalents 40,116 201,932
Cashheldondepositinmarginaccount 80,956 —
Accountsreceivable,lessallowancefordoubtfulaccountsof$15,613in2005
and$7,214in2004 454,313 211,810
Gasstoredunderground 450,807 200,134
Othercurrentassets 238,238 99,319
Totalcurrentassets 1,264,430 713,195
Goodwillandintangibleassets 737,787 245,528
Deferredchargesandotherassets 276,943 231,383
$ 5,653,527$ 2,912,627
CapitalizationandLiabilities
Shareholders’equity
Commonstock,noparvalue(statedat$.005pershare);
200,000,000sharesauthorized,issuedandoutstanding:
2005–80,539,401shares,2004–62,799,710shares $403$ 314
Additionalpaid-incapital 1,426,523 1,005,644
Accumulatedothercomprehensiveloss (3,341) (14,529)
Retainedearnings 178,837 142,030
Shareholders’equity 1,602,422 1,133,459
Long-termdebt 2,183,104 861,311
Totalcapitalization 3,785,526 1,994,770
Currentliabilities
Accountspayableandaccruedliabilities 461,314 185,295
Othercurrentliabilities 503,368 238,682
Short-termdebt 144,809 —
Currentmaturitiesoflong-termdebt 3,264 5,908
Totalcurrentliabilities 1,112,755 429,885
Deferredincometaxes 292,207 241,257
Regulatorycostofremovalobligation 263,424 103,579
Deferredcreditsandotherliabilities 199,615 143,136
$ 5,653,527 $ 2,912,627
YEARENDEDSEPTEMBER30(Dollarsinthousands,exceptpersharedata) 2 0 0 5 2 0 0 4 2 0 0 3
Operatingrevenues
Utilitysegment $ 3,103,140$ 1,637,728 $ 1,554,082
Naturalgasmarketingsegment 2,106,278 1,618,602 1,668,493
Pipelineandstoragesegment 164,742 19,758 20,298
Othernonutilitysegment 5,302 3,393 2,853
Intersegmenteliminations (406,136) (359,444) (445,810)
4,973,326 2,920,037 2,799,916
Purchasedgascost
Utilitysegment 2,195,774 1,134,594 1,062,679
Naturalgasmarketingsegment 2,044,305 1,571,971 1,644,328
Pipelineandstoragesegment 6,811 9,383 3,061
Othernonutilitysegment — — —
Intersegmenteliminations (402,654) (358,102) (445,128)
3,844,236 2,357,846 2,264,940
Grossprofit 1,129,090 562,191 534,976
Operatingexpenses
Operationandmaintenance 427,734 214,470 205,090
Depreciationandamortization 178,005 96,647 87,001
Taxes,otherthanincome 174,696 57,379 55,045
Totaloperatingexpenses 780,435 368,496 347,136
Operatingincome 348,655 193,695 187,840
Miscellaneousincome 2,021 9,507 2,191
Interestcharges 132,658 65,437 63,660
Incomebeforeincometaxesandcumulativeeffectofaccountingchange 218,018 137,765 126,371
Incometaxexpense 82,233 51,538 46,910
Incomebeforecumulativeeffectofaccountingchange 135,785 86,227 79,461
Cumulativeeffectofaccountingchange,netofincometaxbenefit — — (7,773)
Netincome $ 135,785 $ 86,227 $ 71,688
Persharedata
Basicincomepershare:
Incomebeforecumulativeeffectofaccountingchange $ 1.73$ 1.60 $ 1.72
Cumulativeeffectofaccountingchange,netofincometaxbenefit — — (.17)
Netincome $ 1.73$ 1.60 $ 1.55
Dilutedincomepershare:
Incomebeforecumulativeeffectofaccountingchange $ 1.72$ 1.58 $ 1.71
Cumulativeeffectofaccountingchange,netofincometaxbenefit — — (.17)
Netincome $ 1.72 $ 1.58 $ 1.54
Weightedaveragesharesoutstanding:
Basic 78,508 54,021 46,319
Diluted 79,012 54,416 46,496