Assurant 2015 Annual Report Download - page 9
Download and view the complete annual report
Please find page 9 of the 2015 Assurant annual report below. You can navigate through the pages in the report by either clicking on the pages listed below, or by using the keyword search tool below to find specific information within the annual report.-
 1
1 -
 2
2 -
 3
3 -
 4
4 -
 5
5 -
 6
6 -
 7
7 -
 8
8 -
 9
9 -
 10
10 -
 11
11 -
 12
12 -
 13
13 -
 14
14 -
 15
15 -
 16
16 -
 17
17 -
 18
18 -
 19
19 -
 20
20 -
21
-
22
-
23
-
24
-
25
-
26
-
27
-
28
-
29
-
30
-
31
-
32
-
33
-
34
-
35
-
36
-
37
-
38
-
39
-
40
-
41
-
42
-
43
-
44
-
45
-
46
-
47
-
48
-
49
-
50
-
51
-
52
-
53
-
54
-
55
-
56
-
57
-
58
-
59
-
60
-
61
-
62
-
63
-
64
-
65
-
66
-
67
-
68
-
69
-
70
-
71
-
72
-
73
-
74
-
75
-
76
-
77
-
78
-
79
-
80
-
81
-
82
-
83
-
84
-
85
-
86
-
87
-
88
-
89
-
90
-
91
-
92
-
93
-
94
-
95
-
96
-
97
-
98
-
99
-
100
-
101
-
102
-
103
-
104
-
105
-
106
-
107
-
108
-
109
-
110
-
111
-
112
-
113
-
114
-
115
-
116
-
117
-
118
-
119
-
120
-
121
-
122
-
123
-
124
-
125
-
126
-
127
-
128
-
129
-
130
-
131
-
132
-
133
-
134
-
135
-
136
-
137
-
138
-
139
-
140
-
141
-
142
-
143
-
144
-
145
-
146
-
147
-
148
-
149
-
150
-
151
-
152
-
153
-
154
-
155
-
156
-
157
-
158
-
159
-
160
-
161
-
162
-
163
-
164
 |
 |

2015 Assurant Annual Report | 7
Non-GAAP Financial Measures
Assurant uses the following non-GAAP nancial measures to analyze the Company’s operating performance
for the periods presented in this report. Because Assurant’s calculation of these measures may differ from
similar measures used by other companies, investors should be careful when comparing Assurant’s non-GAAP
nancial measures to those of other companies.
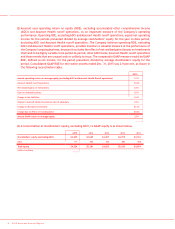
(1) Assurant uses net operating income as an important measure of the Company’s operating performance. As
shown in the following reconciliation table, net operating income equals net income, excluding Assurant
Health runoff operations, net realized gains (losses) on investments and other unusual and/or infrequent
items. The Company believes net operating income provides investors a valuable measure of the
performance of the Company’s ongoing business, because it excludes both the effect of net realized gains
(losses) on investments that tend to be highly variable from period to period, and those events that are
unusual and/or unlikely to recur.
2015
2014 2013 2012 2011
Assurant Solutions $197.2
$218.9 $125.2 $123.8 $136.1
Assurant Specialty Property
307.7 341.8 423.6
305.0
303.7
Assurant Employee Benets
47.3 48.7
34.6 58.1
43.1
Corporate and other
(70.4) (67.7)
(82.9) (62.4)
(60.0)
Amortization of deferred gain on disposal of
businesses
8.4 (1.0)
10.6 12.0
13.3
Interest expense
(35.8) (37.9)
(50.5) (39.2)
(39.2)
Net operating income
454.4 502.8
460.6 397.3
397.0
Adjustments:
Assurant Health runoff operations
(367.9) (63.7)
5.9 52.0
40.9
Net realized gains on investments
20.8 39.4
22.4 41.8
21.1
Change in tax valuation allowance
- -
- -
80.0
Gain (loss) on divested business
10.7 (19.4)
- -
-
Change in tax liabilities
16.0 14.0
- (7.4)
-
Payment received related to previous sale
of subsidiary
9.9 -
- -
-
Change in derivative investment
(2.3)
(2.2) - -
-
Net income
$141.6 $470.9 $488.9 $483.7 $539.0
(dollars in millions, net of tax)