Assurant 2015 Annual Report Download - page 2
Download and view the complete annual report
Please find page 2 of the 2015 Assurant annual report below. You can navigate through the pages in the report by either clicking on the pages listed below, or by using the keyword search tool below to find specific information within the annual report.-
 1
1 -
 2
2 -
 3
3 -
 4
4 -
 5
5 -
 6
6 -
 7
7 -
 8
8 -
 9
9 -
 10
10 -
 11
11 -
 12
12 -
 13
13 -
14
-
15
-
16
-
17
-
18
-
19
-
20
-
21
-
22
-
23
-
24
-
25
-
26
-
27
-
28
-
29
-
30
-
31
-
32
-
33
-
34
-
35
-
36
-
37
-
38
-
39
-
40
-
41
-
42
-
43
-
44
-
45
-
46
-
47
-
48
-
49
-
50
-
51
-
52
-
53
-
54
-
55
-
56
-
57
-
58
-
59
-
60
-
61
-
62
-
63
-
64
-
65
-
66
-
67
-
68
-
69
-
70
-
71
-
72
-
73
-
74
-
75
-
76
-
77
-
78
-
79
-
80
-
81
-
82
-
83
-
84
-
85
-
86
-
87
-
88
-
89
-
90
-
91
-
92
-
93
-
94
-
95
-
96
-
97
-
98
-
99
-
100
-
101
-
102
-
103
-
104
-
105
-
106
-
107
-
108
-
109
-
110
-
111
-
112
-
113
-
114
-
115
-
116
-
117
-
118
-
119
-
120
-
121
-
122
-
123
-
124
-
125
-
126
-
127
-
128
-
129
-
130
-
131
-
132
-
133
-
134
-
135
-
136
-
137
-
138
-
139
-
140
-
141
-
142
-
143
-
144
-
145
-
146
-
147
-
148
-
149
-
150
-
151
-
152
-
153
-
154
-
155
-
156
-
157
-
158
-
159
-
160
-
161
-
162
-
163
-
164
 |
 |

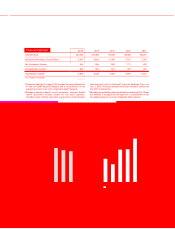
VII | 2015 Assurant Annual Report
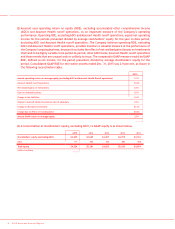
$582 $563
$623
$454
$175
$472
$600
Dividend & Share Repurchases
2011-2015 (in millions)
Share Repurchases
$472
$296
$379
2011201220132014201520112012201320142015
Cash Flow Generation
2011–2015 (in millions)
Dividends
Note: Consists of dividends from operating
subsidiaries to the holding company, net of
infusions, and excluding acquisitions and
divestitures.
Financial Highlights
2015
2014 2013 2012 2011
Total Revenue $10,325
$10,382 $9,048 $8,508 $8,273
Net Earned Premiums, Fees & Other
9,654 9,666 8,347
7,712
7,530
Net Investment Income
626 656
650 713
690
Net Operating Income1, 2
454
503 461 397
397
Shareholders’ Equity3
4,405 4,625 4,407 4,355 4,316
(U.S. dollars in millions)
1 Please see footnote 1 on page 7 of this report for more information
on this non-GAAP nancial measure and a reconciliation of net
operating income to its most comparable GAAP measure.
2 Excluding Assurant Health runoff operations. Assurant Health
runoff operations include results for the total segment,
including major medical operations and portions of the business
that Assurant sold to National General Holdings Corp. on
Oct. 1, 2015. Prior year amounts have been revised to conform to
the 2015 presentation.
3 Excluding accumulated other comprehensive income (AOCI). Please
see footnote 3 on page 8 of this report for a reconciliation of this
non-GAAP measure to its most comparable GAAP measure.