Amgen 2001 Annual Report Download - page 9
Download and view the complete annual report
Please find page 9 of the 2001 Amgen annual report below. You can navigate through the pages in the report by either clicking on the pages listed below, or by using the keyword search tool below to find specific information within the annual report.-
 1
1 -
 2
2 -
 3
3 -
 4
4 -
 5
5 -
 6
6 -
 7
7 -
 8
8 -
 9
9 -
 10
10 -
 11
11 -
 12
12 -
 13
13 -
 14
14 -
 15
15 -
 16
16 -
 17
17 -
 18
18 -
 19
19 -
 20
20 -
21
-
22
-
23
-
24
-
25
-
26
-
27
-
28
-
29
-
30
-
31
-
32
-
33
-
34
-
35
-
36
-
37
-
38
-
39
-
40
-
41
-
42
-
43
-
44
-
45
-
46
-
47
-
48
-
49
-
50
-
51
-
52
-
53
-
54
 |
 |

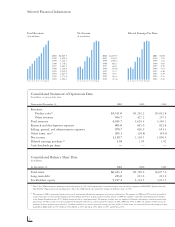
Earnings Performance In a year marked
by preparations for several new product
introductions, Amgen continued to success-
fully balance the need to invest in the
future with the desire to deliver quality
financial results.
Continued growth in demand for the
company’s expanding line of therapeutics
increased total product sales by 10% last
year. Net income, excluding non-recurring
items, was 36% of sales, among the indus-
try’s strongest net margins. Adjusted
earnings per share, adjusted to exclude non-
recurring items in both years, were $1.18
versus $1.05 in 2000, a 12% increase. In
2001, Amgen invested significant resources
required to launch two new products and
to prepare for the launch of a third.
Amgen expects growth in product sales
to expand at an even faster rate through
2005 as new Amgen products gather mar-
ket momentum and the company pursues
applications for new products and new
product indications in health care markets
around the world. Potential new revenue
and earnings streams from these activities
could also help to diversify Amgen’s
sources of income.
Successful completion of Amgen’s proposed
acquisition of Immunex, which would
bring with it an additional blockbuster
therapeutic targeting inflammation, also
has the potential to increase company sales
and earnings (adjusted to exclude merger-
related items) over the next few years.
Amgen’s substantial annual cashflow
from product sales and resulting strong
balance sheet has allowed the company to
reinvest profits into ongoing research and
development programs, the lifeblood of
a successful human therapeutics enterprise.
Research and development spending in
2001 was 25% of total product sales,
among the highest levels in the biotech-
nology and pharmaceuticals industries.
This is the seventh consecutive year
Amgen’s research and development
spending has exceeded 24%.
Financial Foundation Cashflow from
operations, generated largely by Amgen’s
product sales, totaled nearly $1.5 billion in
2001. The size and quality of the company’s
cashflow has allowed Amgen to finance
nearly all of its operations since the success-
ful market debuts of EPOGEN
®
and
NEUPOGEN
®
. Historically, Amgen has
reinvested in the company’s core business,
in capital expenditures, in collaborations
and new initiatives, and in selective
share repurchases.
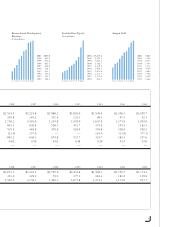
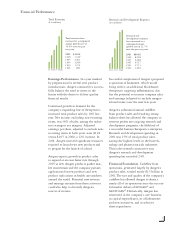
Financial Performance
91 93 95 97 99 01
Total Revenues
($ in millions)
2001 $4,016
1999 3,340
1997 2,401
1995 1,940
1993 1,374
1991 682
Total revenues have
increased at a compound
annual growth rate of
19.4% over the past
ten years.
7
91 93 95 97 99 01
Research and Development Expenses
($ in millions)
2001 $865.0
1999 822.8
1997 630.8
1995 451.7
1993 255.3
1991 120.9
Research and
development expenses
have increased at a
compound annual
growth rate of 21.7%
over the past ten years.