Airtran 2006 Annual Report Download - page 24
Download and view the complete annual report
Please find page 24 of the 2006 Airtran annual report below. You can navigate through the pages in the report by either clicking on the pages listed below, or by using the keyword search tool below to find specific information within the annual report.-
 1
1 -
2
-
3
-
4
-
5
-
6
-
7
-
8
-
9
-
10
-
11
-
12
-
13
-
 14
14 -
 15
15 -
 16
16 -
 17
17 -
 18
18 -
 19
19 -
 20
20 -
 21
21 -
 22
22 -
 23
23 -
 24
24 -
 25
25 -
 26
26 -
 27
27 -
 28
28 -
 29
29 -
 30
30 -
 31
31 -
 32
32 -
 33
33 -
 34
34 -
35
-
36
-
37
-
38
-
39
-
40
-
41
-
42
-
43
-
44
-
45
-
46
-
47
-
48
-
49
-
50
-
51
-
52
-
53
-
54
-
55
-
56
-
57
-
58
-
59
-
60
-
61
-
62
-
63
-
64
-
65
-
66
-
67
-
68
-
69
 |
 |

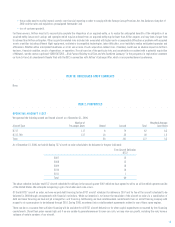
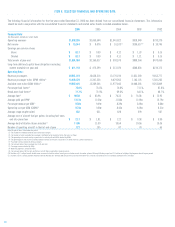
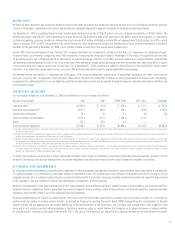
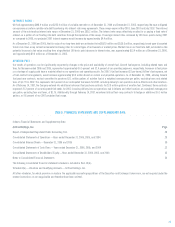
The following financial information for the five years ended December 31, 2006 has been derived from our consolidated financial statements. This information
should be read in conjunction with the consolidated financial statements and related notes thereto included elsewhere herein.
2006 2005 2004 2003 2002
Financial Data :
(In thousands, except per share data)
Operating revenues $1,893,355 $1,450,544 $1,041,422 $918,040 $733,370
Net income $ 15,514 $ 8,076 $ 10,103(10) $100,517(11) $ 10,745
Earnings per common share:
Basic $ 0.17 $ 0.09 $ 0.12 $ 1.33 $ 0.15
Diluted $ 0.17 $ 0.09 $ 0.11 $ 1.21 $ 0.15
Total assets at year-end $1,601,584 $1,160,017 $ 903,579 $808,364 $473,450
Long-term debt and capital lease obligations including
current maturities at year-end $ 811,110 $ 472,599 $ 313,970 $246,836 $210,173
Operating Data :
Revenue passengers 20,051,219 16,638,214 13,170,230 11,651,340 9,653,777
Revenue passenger miles (RPM) (000s)(1) 13,836,378 11,301,534 8,479,262 7,143,125 5,581,263
Available seat miles (ASM) (000s)(2) 19,007,416 15,369,505 11,977,443 10,046,385 8,255,809
Passenger load factor(3) 72.8% 73.5% 70.8% 71.1% 67.6%
Break-even load factor(4) 71.7% 72.9% 69.6% 64.1% 66.7%
Average fare(5) $ 90.58 $ 83.98 $ 76.33 $ 76.38 $ 73.93
Average yield per RPM(6) 13.13¢ 12.36¢ 11.86¢ 12.46¢ 12.79¢
Passenger revenue per ASM(7) 9.56¢ 9.09¢ 8.39¢ 8.86¢ 8.64¢
Operating cost per ASM (CASM)(8) 9.74¢ 9.28¢ 8.45¢ 8.28¢ 8.51¢
Average stage length (miles) 652 651 628 599 567
Average cost of aircraft fuel per gallon, including fuel taxes
and into-plane fees $ 2.17 $ 1.81 $ 1.22 $ 0.98 $ 0.90
Average daily utilization (hours:minutes)(9) 11:06 11:00 10:54 10:56 10:36
Number of operating aircraft in fleet at end of year 127 105 87 74 65
Note: All special items listed below are pretax.
(1) The number of scheduled revenue miles flown by passengers
(2) The number of seats available for passengers multiplied by the number of miles the seats are flown
(3) The percentage of aircraft seating capacity that is actually utilized (RPMs divided by ASMs)
(4) The percentage of seats that must be occupied by revenue passengers in order for us to break even on a pretax income basis
(5) Passenger revenue divided by total passengers
(6) The average amount one passenger pays to fly one mile
(7) Passenger revenue divided by ASMs
(8) Operating expenses, divided by ASMs
(9) The average amount of time per day that an aircraft flown is operated in revenue service
(10) Includes a $1.3 million benefit related to our unsuccessful bid for certain leased gates and other assets of another airline at Chicago’s Midway airport and $1.5 million of additional fuel expense related to prior periods
(11) Includes a $38.1 million payment received under the Wartime Act, deferred debt discount/issuance cost write-off of $12.3 million and reversal of a tax valuation allowance of $15.9 million
18
ITEM 6. SELECTED FINANCIAL AND OPERATING DATA