Airtran 2005 Annual Report Download - page 16
Download and view the complete annual report
Please find page 16 of the 2005 Airtran annual report below. You can navigate through the pages in the report by either clicking on the pages listed below, or by using the keyword search tool below to find specific information within the annual report.-
 1
1 -
2
-
3
-
4
-
5
-
 6
6 -
 7
7 -
 8
8 -
 9
9 -
 10
10 -
 11
11 -
 12
12 -
 13
13 -
 14
14 -
 15
15 -
 16
16 -
 17
17 -
 18
18 -
 19
19 -
 20
20 -
 21
21 -
 22
22 -
 23
23 -
 24
24 -
 25
25 -
 26
26 -
27
-
28
-
29
-
30
-
31
-
32
-
33
-
34
-
35
-
36
-
37
-
38
-
39
-
40
-
41
-
42
-
43
-
44
-
45
-
46
-
47
-
48
-
49
-
50
-
51
-
52
 |
 |

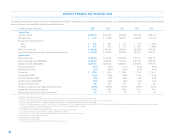
:: NON-OPERATING (INCOME) EXPENSE : :
Other (income) expense, net decreased by $2.4 million (18.4 percent). Increases in rates earned on cash and higher investment balances increased interest income by $6.5 million. Interest expense increased by
$5.3 million and debt issuance cost amortization expense increased by $1.1 million, primarily due to the issuance of new debt relating to new aircraft financing during the twelve months ended December 31, 2005.
Capitalized interest income increased $3.6 million due to a $63.7 million increase in progress payment balances on aircraft commitments in 2005 compared to 2004. Additionally, $1.3 million of other income is
included in our 2004 results relating to payment of a break-up fee to us in connection with our unsuccessful bid for certain leased gates and other assets of another airline at Chicago’s Midway airport.
:: INCOME TAX EXPENSE : :
Our effective income tax rate was 41.1 percent and 38.8 percent for the twelve months ended December 31, 2005, and 2004, respectively. Our tax expense for December 31, 2005 includes a one-time benefit of $1.7
million resulting from an adjustment to our deferred tax liabilities for a decrease in our state effective rate. The overall rate increase resulted primarily from permanent differences related to stock compensation.
At December 31, 2005 and 2004, NOL carryforwards for income tax purposes were approximately $264.2 million and $233.5 million, respectively, which begin to expire in 2017. Management has determined that it is
more likely than not that the deferred tax assets will be realized due to the reversal of deferred tax liabilities and projected short-term income, therefore, no valuation allowance has been recorded at December 31,
2005 and 2004.
: : 2004 COMPARED TO 2003 : :
: : SUMMARY : :
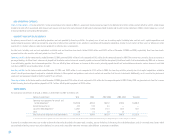
Our performance during 2004 marked a major financial milestone – we surpassed one billion dollars in total revenues for the year. We recorded operating income of $32.8 million, net income of $12.3 million and
diluted earnings per common share of $0.14 for the twelve months ended December 31, 2004. These 2004 results reflect a $0.8 million net credit primarily related to our unsuccessful bid for certain leased gates
and other assets of another airline at Chicago’s Midway airport. For the comparative period in 2003, we recorded operating income of $86.3 million, net income of $100.5 million, and diluted earnings per common
share of $1.21.
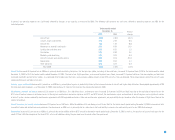
:: OPERATING REVENUES : :
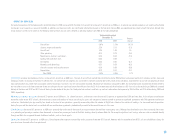
Our operating revenues for the twelve months ended December 31, 2004 increased $123.4 million (13.4 percent), primarily due to a 13.0 percent increase in passenger revenues. The increase in passenger revenues
was largely due to an 18.7 percent increase in traffic, as measured by revenue passenger miles (RPMs), offset by a decrease in our average yield per RPM of 4.8 percent to 11.86 cents per RPM. The decrease
in yield resulted from a 5.1 percent increase in our average passenger trip length to 644 miles combined with a 0.1 percent decrease in our average fare to $76.33. This decrease in yield, when combined with our
0.3 percentage point decrease in passenger load factor, resulted in a 5.3 percent decrease in passenger unit revenues or passenger revenue available seat miles (RASM) to 8.39 cents per ASM.
We placed an order with an aircraft manufacturer in 2003 for up to 110 aircraft, including options and purchase rights. During the twelve months ended December 31, 2004, we took delivery of six B717 aircraft and
eight B737 aircraft and retired one McDonnell Douglas DC-9 aircraft. As a result, our capacity, as measured by available seat miles (ASMs), increased 19.2 percent. Our traffic, as measured by RPMs, increased 18.7
percent, resulting in a 0.3 percentage point decrease in passenger load factor to 70.8 percent.
Other revenues increased $8.1 million (28.7 percent), primarily due to fees earned from our AirTran Airways branded credit card issued by a third-party financial institution, in addition to change and cancellation
fees derived from our overall increase in traffic.
:: ::
14