Air Canada 2010 Annual Report Download - page 16
Download and view the complete annual report
Please find page 16 of the 2010 Air Canada annual report below. You can navigate through the pages in the report by either clicking on the pages listed below, or by using the keyword search tool below to find specific information within the annual report.-
 1
1 -
2
-
3
-
4
-
5
-
 6
6 -
 7
7 -
 8
8 -
 9
9 -
 10
10 -
 11
11 -
 12
12 -
 13
13 -
 14
14 -
 15
15 -
 16
16 -
 17
17 -
 18
18 -
 19
19 -
 20
20 -
 21
21 -
 22
22 -
 23
23 -
 24
24 -
 25
25 -
 26
26 -
27
-
28
-
29
-
30
-
31
-
32
-
33
-
34
-
35
-
36
-
37
-
38
-
39
-
40
-
41
-
42
-
43
-
44
-
45
-
46
-
47
-
48
-
49
-
50
-
51
-
52
-
53
-
54
-
55
-
56
-
57
-
58
-
59
-
60
-
61
-
62
-
63
-
64
-
65
-
66
-
67
-
68
-
69
-
70
-
71
-
72
-
73
-
74
-
75
-
76
-
77
-
78
-
79
-
80
-
81
-
82
-
83
-
84
-
85
-
86
-
87
-
88
-
89
-
90
-
91
-
92
-
93
-
94
-
95
-
96
-
97
-
98
-
99
-
100
-
101
-
102
-
103
-
104
-
105
-
106
-
107
-
108
-
109
-
110
-
111
-
112
-
113
-
114
-
115
-
116
-
117
-
118
-
119
-
120
-
121
-
122
-
123
-
124
-
125
-
126
-
127
-
128
-
129
-
130
-
131
-
132
-
133
-
134
-
135
-
136
-
137
-
138
-
139
-
140
-
141
-
142
-
143
-
144
 |
 |

2010 Air Canada Annual Report
16
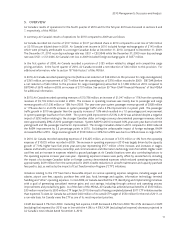
The table below provides year-over-year percentage changes in Atlantic passenger revenues, capacity, traffic, passenger load
factor, yield and RASM by quarter for the fourth quarter 2010 and each of the previous four quarters.
Year-over-Year by Quarter (% Change)
Atlantic Q4’09 Q1'10 Q2'10 Q3’10 Q4’10
Passenger Revenues (4.8) 6.5 12.8 16.3 7.5
Capacity (ASMs) 6.7 6.2 2.4 12.3 5.5
Traffic (RPMs) 2.4 5.8 3.2 12.3 2.5
Passenger Load Factor (pp Change) (3.3) (0.3) 0.7 - (2.2)
Yield (7.0) 0.5 9.2 3.5 4.7
RASM (10.8) 0.1 10.0 3.4 1.7
Components of the year-over-year change in fourth quarter Atlantic passenger revenues included:
t "USBGGJDJODSFBTFPGPOUIFDBQBDJUZHSPXUIPGXIJDISFTVMUFEJOBQBTTFOHFSMPBEGBDUPSEFDSFBTFPG
2.2 percentage points from the fourth quarter of 2009. Despite continued traffic growth on many major Atlantic
services originating from Canada, the U.S. and Europe, competitive pressure, both in terms of pricing and added
capacity, had a negative impact on Air Canada’s local and connecting traffic in France, Switzerland and Germany. On
routes to Israel, traffic gains did not fully meet the capacity growth.
t 5IFDBQBDJUZJODSFBTFJOUIFGPVSUIRVBSUFSPGSFGMFDUFEUIFBEEJUJPOPGOFXSPVUFTJODMVEJOHUIFGPMMPXJOH
year-round services which started in June 2010, namely: Toronto-Montreal-Brussels and Toronto-Copenhagen and
the following summer seasonal services which operated into October 2010, namely: Montreal-Barcelona, Toronto-
Barcelona, Toronto-Athens, Montreal-Athens, as well as additional frequencies on Toronto-Tel Aviv commencing in
June 2010.
t "OBEKVTUFEZJFMEJNQSPWFNFOUPGGSPNUIFGPVSUIRVBSUFSPGXIJDISFGMFDUFEBHSFBUFSQSPQPSUJPOPG
higher-yield premium traffic, a notable return in business travel demand and the airline’s strong focus on promoting
premium services. The year-over-year fourth quarter Atlantic yield improvement was achieved in spite of a $13
million unfavourable impact of a stronger Canadian dollar on foreign currency denominated Atlantic passenger
revenues.
t "OBEKVTUFE"UMBOUJD3"4.JODSFBTFPGGSPNUIFGPVSUIRVBSUFSPGXIJDIXBTEVFUPUIFZJFMEHSPXUI
Pacific passenger revenues increased 31.7% from the fourth quarter of 2009
Pacific passenger revenues of $261 million in the fourth quarter of 2010 increased $62 million or 31.7% from the fourth
quarter of 2009 due to yield and traffic growth. In the fourth quarter of 2010, capacity increased 23.0% from the fourth
quarter of 2009 with growth reflected on all major Pacific services.
The table below provides year-over-year percentage changes in Pacific passenger revenues, capacity, traffic, passenger load
factor, yield and RASM by quarter for the fourth quarter 2010 and each of the previous four quarters.
Year-over-Year by Quarter (% Change)
Pacific Q4’09 Q1'10 Q2'10 Q3’10 Q4’10
Passenger Revenues (9.7) 14.5 37.3 37.7 31.7
Capacity (ASMs) 6.5 25.6 17.5 10.9 23.0
Traffic (RPMs) 4.2 23.6 27.0 17.1 22.9
Passenger Load Factor (pp Change) (1.8) (1.4) 6.7 4.8 (0.1)
Yield (13.4) (7.4) 8.1 17.5 7.2
RASM (15.2) (8.8) 16.9 24.1 7.0