Air Canada 2010 Annual Report Download - page 15
Download and view the complete annual report
Please find page 15 of the 2010 Air Canada annual report below. You can navigate through the pages in the report by either clicking on the pages listed below, or by using the keyword search tool below to find specific information within the annual report.-
 1
1 -
2
-
3
-
4
-
 5
5 -
 6
6 -
 7
7 -
 8
8 -
 9
9 -
 10
10 -
 11
11 -
 12
12 -
 13
13 -
 14
14 -
 15
15 -
 16
16 -
 17
17 -
 18
18 -
 19
19 -
 20
20 -
 21
21 -
 22
22 -
 23
23 -
 24
24 -
 25
25 -
26
-
27
-
28
-
29
-
30
-
31
-
32
-
33
-
34
-
35
-
36
-
37
-
38
-
39
-
40
-
41
-
42
-
43
-
44
-
45
-
46
-
47
-
48
-
49
-
50
-
51
-
52
-
53
-
54
-
55
-
56
-
57
-
58
-
59
-
60
-
61
-
62
-
63
-
64
-
65
-
66
-
67
-
68
-
69
-
70
-
71
-
72
-
73
-
74
-
75
-
76
-
77
-
78
-
79
-
80
-
81
-
82
-
83
-
84
-
85
-
86
-
87
-
88
-
89
-
90
-
91
-
92
-
93
-
94
-
95
-
96
-
97
-
98
-
99
-
100
-
101
-
102
-
103
-
104
-
105
-
106
-
107
-
108
-
109
-
110
-
111
-
112
-
113
-
114
-
115
-
116
-
117
-
118
-
119
-
120
-
121
-
122
-
123
-
124
-
125
-
126
-
127
-
128
-
129
-
130
-
131
-
132
-
133
-
134
-
135
-
136
-
137
-
138
-
139
-
140
-
141
-
142
-
143
-
144
 |
 |

2010 Management’s Discussion and Analysis
15
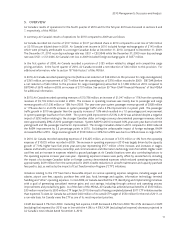
The table below provides year-over-year percentage changes in U.S. transborder passenger revenues, capacity, traffic,
passenger load factor, yield and RASM by quarter for the fourth quarter 2010 and each of the previous four quarters.
Year-over-Year by Quarter (% Change)
U.S. transborder Q4’09 Q1'10 Q2'10 Q3’10 Q4’10
Passenger Revenues (3.7) 6.0 11.3 10.4 10.7
Capacity (ASMs) (1.8) 2.8 7.3 13.3 11.7
Traffic (RPMs) (5.0) 3.4 10.3 12.8 12.0
Passenger Load Factor (pp Change) (2.5) 0.5 2.0 (0.3) 0.2
Yield 1.4 2.5 0.8 (2.3) (1.3)
RASM (1.9) 3.1 3.6 (2.7) (1.0)
Components of the year-over-year change in fourth quarter U.S. transborder passenger revenues included:
t "USBGGJDJODSFBTFPGPOUIFDBQBDJUZHSPXUIPGXIJDISFTVMUFEJOBQBTTFOHFSMPBEGBDUPSJNQSPWFNFOU
of 0.2 percentage points from the fourth quarter of 2009. The year-over-year capacity growth included:
- The introduction of new daily services from Toronto to San Diego, California; Memphis, Tennessee; New Orleans,
Louisiana; Cincinnati, Ohio; Portland, Maine; Portland, Oregon and Syracuse, New York and new daily services
from Montreal to Phoenix, Arizona;
- An increase in capacity on routes to California between Toronto and Los Angeles through the use of larger
aircraft and between Toronto and San Francisco through an increase in frequencies;
- An increase in capacity on routes to Florida between Toronto and Fort Lauderdale, and Toronto and Miami
through an increase in frequencies;
- An earlier start-up of Air Canada’s seasonal service between Calgary and Honolulu, and Calgary and Maui;
- An increase in capacity in the eastern seaboard market (New York, Boston, Washington, Pittsburg and
Philadelphia) through the combination of an increase in frequencies and the use of larger aircraft.
The suspension of the following services partly offset this capacity growth: Edmonton-Los Angeles, Edmonton-Las
Vegas, Calgary-San Diego, Calgary-Seattle and Calgary-Portland, Oregon.
t "ZJFMEEFDMJOFPGGSPNUIFGPVSUIRVBSUFSPGXIJDIXBTEVFUPUIFJNQBDUPGNPSFBHHSFTTJWFDPNQFUJUJWF
pricing in the U.S. transborder market and a higher proportion of international traffic flowing to and from the U.S.
producing lower yields on the U.S. transborder segments, thereby impacting the overall U.S. transborder yield while
increasing revenues in the international market. Yield improvements were achieved on all major routes with the
exception of routes to Florida and California where incremental and new competitive flying resulted in lower yields.
The unfavourable impact of a stronger Canadian dollar on foreign currency denominated U.S. transborder passenger
revenues was also a factor in the year-over-year yield decline, accounting for a decrease of $8 million to fourth
quarter 2010 U.S. transborder passenger revenues.
t "64USBOTCPSEFS3"4.EFDSFBTFPGGSPNUIFGPVSUIRVBSUFSPGXIJDIXBTEVFUPUIFEFDMJOFJOZJFME
Atlantic passenger revenues increased 7.5% from the fourth quarter of 2009
On an adjusted basis, Atlantic passenger revenues of $404 million in the fourth quarter of 2010 increased $28 million or
7.5% from the fourth quarter of 2009 due to yield and traffic growth. In the fourth quarter of 2010, Atlantic capacity
increased 5.5% from the fourth quarter of 2009, with capacity growth reflected on all major Atlantic services with the
exception of routes to the U.K. and Germany.