Aer Lingus 2008 Annual Report Download - page 4
Download and view the complete annual report
Please find page 4 of the 2008 Aer Lingus annual report below. You can navigate through the pages in the report by either clicking on the pages listed below, or by using the keyword search tool below to find specific information within the annual report.-
 1
1 -
 2
2 -
 3
3 -
 4
4 -
 5
5 -
 6
6 -
 7
7 -
 8
8 -
 9
9 -
 10
10 -
 11
11 -
 12
12 -
 13
13 -
 14
14 -
 15
15 -
16
-
17
-
18
-
19
-
20
-
21
-
22
-
23
-
24
-
25
-
26
-
27
-
28
-
29
-
30
-
31
-
32
-
33
-
34
-
35
-
36
-
37
-
38
-
39
-
40
-
41
-
42
-
43
-
44
-
45
-
46
-
47
-
48
-
49
-
50
-
51
-
52
-
53
-
54
-
55
-
56
-
57
-
58
-
59
-
60
-
61
-
62
-
63
-
64
-
65
-
66
-
67
-
68
-
69
-
70
-
71
-
72
-
73
-
74
-
75
-
76
-
77
-
78
-
79
-
80
-
81
-
82
-
83
-
84
-
85
-
86
-
87
-
88
-
89
-
90
-
91
-
92
 |
 |

AER LINGUS GROUP PLC - ANNUAL REPORT 2008
2
SAN FRANCISCO
BOSTON
ORLANDO
NEW YORK
WASHINGTON
AER LINGUS GROUP PLC - ANNUAL REPORT 2008
LONDON
BRUSSELS
BERLIN
PARIS
MADRID
FARO
Chairman’s Review
2008 was an exceptionally challenging year for the
worldwide aviation industry. For Aer Lingus, a combination
of weaker consumer demand, lower dollar and sterling
revenues and increased competition across the network
put sustained and significant pressure on our business.
Meanwhile, record high fuel prices had a significant
negative impact on our costs.
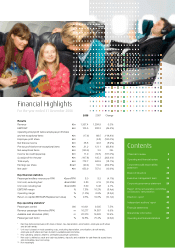
The financial performance for the year reflected this
environment. While total revenue increased by 5.6% to
€1,357.4 million, the company reported an operating loss
before exceptional items of €17.6 million and a small profit
before exceptional items of €21.2 million. Exceptional
costs of €140.9 million – mainly compensation for staff
restructuring – and a tax credit of €11.9 million, together
turned this net profit into a loss for the year of €107.8
million. This compares to a profit of €105.3 million in
2007. The basic and diluted loss per share was 20.4 cent
as compared to earnings per share of 19.9 cent in 2007.
Return on capital in 2008 was 9.5% as compared to
19.6% in 2007. Our balance sheet is strong, with net cash
of €653.9 million at year-end. While 2008 was a tough
year, Aer Lingus remains a strong company.
Total passenger capacity was increased by 13.9%
in 2008. However, as a result of intense competition
and weaker consumer demand, passenger volume
increased by only 7.5%. The resulting passenger load
factor of 72.8% compared to 75.4% in 2007. However,
the weaker demand and currency situations resulted
in a 4.6% fall in average fares. Encouragingly, ancillary
revenues performed strongly, rising by 37.7% to €149.7
million, mainly because of a 28.1% increase in the
ancillary spend of each passenger, to nearly €15.
2008 Key points
n Pre-tax profit before exceptional costs of €21.2
million, after an operating loss of €17.6 million.
n A net loss after exceptional items of €107.8
million, reflecting exceptional costs of €140.9
million related mainly to the staff cost saving
agreement completed prior to year end.
n Continued revenue growth, reflecting modest
passenger growth, reduced passenger fares
and weaker non-euro currencies and strong
growth in ancillary revenues.