Adidas 2003 Annual Report Download - page 3
Download and view the complete annual report
Please find page 3 of the 2003 Adidas annual report below. You can navigate through the pages in the report by either clicking on the pages listed below, or by using the keyword search tool below to find specific information within the annual report.-
 1
1 -
 2
2 -
 3
3 -
 4
4 -
 5
5 -
 6
6 -
 7
7 -
 8
8 -
 9
9 -
 10
10 -
 11
11 -
 12
12 -
 13
13 -
 14
14 -
15
-
16
-
17
-
18
-
19
-
20
-
21
-
22
-
23
-
24
-
25
-
26
-
27
-
28
-
29
-
30
-
31
-
32
-
33
-
34
-
35
-
36
-
37
-
38
-
39
-
40
-
41
-
42
-
43
-
44
-
45
-
46
-
47
-
48
-
49
-
50
-
51
-
52
-
53
-
54
-
55
-
56
-
57
-
58
-
59
-
60
-
61
-
62
-
63
-
64
-
65
-
66
-
67
-
68
-
69
-
70
-
71
-
72
-
73
-
74
-
75
-
76
-
77
-
78
-
79
-
80
-
81
-
82
-
83
-
84
-
85
-
86
-
87
-
88
-
89
-
90
-
91
-
92
-
93
-
94
-
95
-
96
-
97
-
98
-
99
-
100
-
101
-
102
-
103
-
104
-
105
-
106
-
107
-
108
-
109
-
110
-
111
-
112
-
113
-
114
-
115
-
116
-
117
-
118
-
119
-
120
-
121
-
122
-
123
-
124
-
125
-
126
-
127
-
128
-
129
-
130
-
131
-
132
-
133
-
134
-
135
-
136
-
137
-
138
-
139
-
140
-
141
-
142
-
143
-
144
-
145
-
146
-
147
-
148
-
149
-
150
-
151
-
152
-
153
-
154
-
155
-
156
-
157
-
158
-
159
-
160
-
161
-
162
-
163
-
164
-
165
-
166
-
167
-
168
-
169
-
170
 |
 |

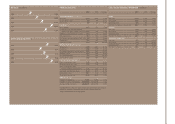
adidas-Salomon SEGMENTAL INFORMATION € in millions
2003 2002 Change
adidas
Net sales 4,950 5,105 (3.0%)
Gross profit 2,008 2,004 0.2%
Operating profit 365 343 6.3%
Number of employees at year-end 9,547 8,852 7.9%
Salomon
Net sales 658 684 (3.8%)
Gross profit 264 279 (5.5%)
Operating profit 35 39 (9.8%)
Number of employees at year-end 2,829 2,795 1.2%
TaylorMade-adidas Golf
Net sales 637 707 (10.0%)
Gross profit 290 345 (16.0%)
Operating profit 67 74 (9.2%)
Number of employees at year-end 1,166 1,078 8.2%
FINANCIAL HIGHLIGHTS
2003 2002 Change
Operating Highlights € in millions
Net sales 6,267 6,523 (3.9%)
Income before taxes 438 390 12.3%
Net income 260 229 13.8%
Key Ratios %
Gross margin 44.9 43.2 1.7pp
Selling, general and administrative
expenses as a percentage of net sales 35.6 34.4 1.1pp
EBITDA as a percentage of net sales 10.2 9.3 0.9pp
Effective tax rate 38.0 37.9 0.1pp
Net income as a percentage of net sales 4.2 3.5 0.6pp
Equity ratio 32.4 25.4 7.0pp
Financial leverage 69.8 138.5 (68.7pp)
Balance Sheet Data € in millions
Total assets 4,188 4,261 (1.7%)
Inventories 1,164 1,190 (2.2%)
Receivables and other current assets 1,335 1,560 (14.5%)
Working capital 1,433 1,445 (0.8%)
Net total borrowings 946 1,498 (36.8%)
Shareholders’ equity 1,356 1,081 25.4%
Per Share of Common Stock €
Basic earnings per share 5.72 5.04 13.6%
Diluted earnings per share 5.72 5.04 13.6%
Basic earnings per share
(without goodwill amortization) 6.71 6.04 11.1%
Operating cash flow per share 14.32 11.77 21.7%
Dividend per share 1.001)1.00 0.0%
Share price at year-end 90.30 82.30 9.7%
Other at year-end
Number of employees 15,686 14,716 6.6%
Number of shares outstanding 45,453,750 45,422,500 0.1%
Average number of shares 45,452,361 45,366,100 0.2%
Rounding differences may arise in percentages and totals for figures presented in
millions as calculation is always based on the figures stated in thousands.
1)Subject to Annual General Meeting approval
NET SALES € in millions
1999 5,354
2000 5,835
2001 6,112
2002 6,523
2003 6,267
BASIC EARNINGS PER SHARE €
1999 5.02
2000 4.01
2001 4.60
2002 5.04
2003 5.72