Access America 2008 Annual Report Download - page 51
Download and view the complete annual report
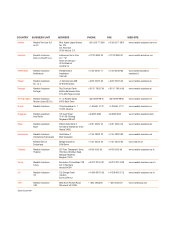
Please find page 51 of the 2008 Access America annual report below. You can navigate through the pages in the report by either clicking on the pages listed below, or by using the keyword search tool below to find specific information within the annual report.-
 1
1 -
2
-
3
-
4
-
5
-
6
-
7
-
8
-
9
-
10
-
11
-
12
-
13
-
14
-
15
-
16
-
17
-
18
-
19
-
20
-
21
-
22
-
23
-
24
-
25
-
26
-
27
-
28
-
29
-
30
-
31
-
32
-
33
-
34
-
35
-
36
-
37
-
38
-
39
-
40
-
 41
41 -
 42
42 -
 43
43 -
 44
44 -
 45
45 -
 46
46 -
 47
47 -
 48
48 -
 49
49 -
 50
50 -
 51
51 -
 52
52 -
 53
53 -
 54
54
 |
 |

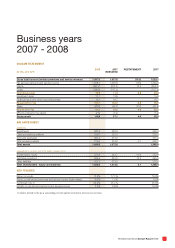
Mondial Assistance Annual Report 2008 47
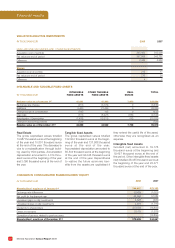
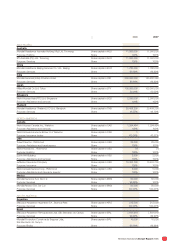
INCOME STATEMENT
IN MILLION EUR
2008 2007
RESTATED
RESTA TEMENT 2007
Gross total turnover (written premiums and service revenue) 1,597.0 1,507.8 (15.3) 1,523.1
Net earned premiums and service income 1,568.1 1,455.8 (8.5) 1,464.3
Claims (691.7) (637.2) 15.3 (652.5)
Costs (796.5) (747.2) (747.2)
Operating result 79.9 71.4 6.8 64.6
Investment result 11.1 13.9 13.9
Financial result and other income/expenses 12.1 16.7 16.7
Result before Tax 103.1 102.0 6.8 95.2
Taxes (38.0) (43.0) (2.2) (40.8)
Result after Tax 65.1 59.0 4.6 54.4
Minority interest in the results (2.5) (1.9) (1.9)
Group result 62.6 57.1 4.6 52.5
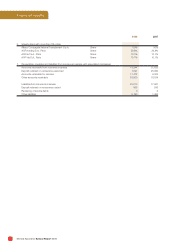
BALANCE SHEET
ASSETS
Investments 581.6 562.4 562.4
Cash and cash equivalents 239.7 225.0 225.0
Accounts receivable 397.2 351.9 351.9
Total remaining assets 216.5 233.2 4.1 229.1
Total assets 1,435.0 1,372.5 1,368.4
SHAREHOLDERS’ EQUITY AND LIABILITIES
Shareholders’ equity 379.4 344.7 (9.2) 353.9
Technical provisions 644.5 653.3 13.3 640.0
Other liabilities 411.1 374.5 374.5
Total shareholders’ equity and liabilities 1,435.0 1,372.5 4.1 1,368.4
KEY FIGURES
Return on equity 17.3% 17.1% 15.5%
Return on net earned premiums and service income (before taxes) 6.6% 7.0% 6.5%
Combined ratio 1) 94.9% 95.1% 95.6%
Growth on net earned premiums and service income 7.7% 9.9% 10.6%
1) Claims and all costs as a percentage of net earned premiums and service income.
Business years
2007 - 2008