Access America 2005 Annual Report Download - page 20
Download and view the complete annual report
Please find page 20 of the 2005 Access America annual report below. You can navigate through the pages in the report by either clicking on the pages listed below, or by using the keyword search tool below to find specific information within the annual report.-
 1
1 -
2
-
3
-
4
-
5
-
6
-
7
-
8
-
9
-
 10
10 -
 11
11 -
 12
12 -
 13
13 -
 14
14 -
 15
15 -
 16
16 -
 17
17 -
 18
18 -
 19
19 -
 20
20
 |
 |

36
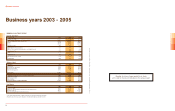
Business years 2003 - 2005
Concept : Ludéric Marketing Relationnel - Texts : Dixit - Photos : Getty Images, Graphic Obsession, Corbis, D.R.
Mondial Assistance Group would like to thank
all its staff for the kind contribution to this annual report.
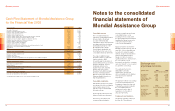
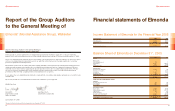
MONDIAL ASSISTANCE GROUP
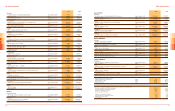
Income Statement
in million EUR 2005 2004 2003
Income Statement
Total Turnover (Premiums and Service revenue) 1 220.5 1 099.7 995.5
Net earned premiums and service income 1 159.8 1 060.9 962.3
Claims (577.9) (531.6) (496.6)
Costs (536.3) (484.8) (441.5)
Operating result 45.6 44.6 24.2
Financial result 1) 30.4 10.1 16.9
Reallocation of technical interest
Other income/expenses and depreciation on intangible assets 0.1 (3.2) (3.9)
Result before Tax 76.1 51.5 37.2
Taxes (27.0) (27.8) (20.4)
Result after Tax 49.1 23.6 16.8
Minority interest in the results (1.3) (0.5) (1.2)
Group result 47.8 23.1 15.6
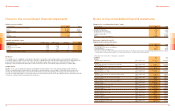
Balance Sheet
ASSETS 2005 2004 2003
Investments 537.1 467.2 418.6
Cash and cash equivalents 158.5 135.9 173.2
Accounts receivable 250.4 228.9 228.6
Total remaining assets 201.1 174.6 173.4
Total assets 1 147.1 1 006.6 993.8
SHAREHOLDERS’ EQUITY AND LIABILITIES 2005 2004 2003
Shareholders’ equity 301.0 268.0 263.7
Technical provisions 514.9 457.3 410.9
Other liabilities 331.2 281.3 319.2
Total shareholders’ equity and liabilities 1 147.1 1 006.6 993.8
Key Figures
2005 2004 2003
Return on equity 16.8% 8.7% 6.0%
Return on earned premiums and service income (before taxes) 6.6% 4.8% 3.9%
Combined ratio 2) 96.1% 95.8% 97.5%
Growth earned premiums and service income 9.3% 10.2% 3.0%
1) The financial result includes ordinary, realised, accounting and exchange rate gains.
2) Claims and all costs as a percentage of net earned premiums and service income.