Access America 2005 Annual Report Download - page 16
Download and view the complete annual report
Please find page 16 of the 2005 Access America annual report below. You can navigate through the pages in the report by either clicking on the pages listed below, or by using the keyword search tool below to find specific information within the annual report.-
 1
1 -
2
-
3
-
4
-
5
-
 6
6 -
 7
7 -
 8
8 -
 9
9 -
 10
10 -
 11
11 -
 12
12 -
 13
13 -
 14
14 -
 15
15 -
 16
16 -
 17
17 -
 18
18 -
 19
19 -
 20
20
 |
 |

2928
Notes to the consolidated financial statements
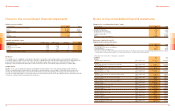
Changes in the consolidated shareholders’ equity
in thousand EUR 2005 2004
Shareholders’ equity on January 1st 268 033 263 653
Exchange rate differences 2 982 850
Net profit for the financial year 47 773 23 121
Unrealised gains on afs investments (561) 1 959
Unrealised losses on afs investments (196) 1 138
Dividends to shareholders (16 752) (20 432)
Others (327) (2 256)
Shareholders’ equity on December 31st 300 952 268 033
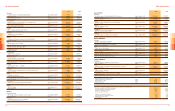
Disclosures of Article 663 a/b CO,
supplemented by voluntary information
in thousand EUR if not otherwise indicated 2005 2004
1. Contingent liabilities 57 972 48 335
2. Assets pledged as security for own obligations 129 129
3. Leasing obligations 78 618 98 329
4. Fire insurance value for tangible assets 85 932 76 400
5. Elvia Reiseversicherungs-Gesellschaft AG, Zurich and Elmonda belong to the the Allianz Suisse Insurance value added tax group and are therefore jointly and
severably liable for all value added tax liablities of the value added tax group to the Swiss Federal Tax Administration.
6. Participations with at least 20% of voting rights or capital share
EUROPE 2005 2004
Austria
ELVIA Assistance GmbH, Vienna Share capital in ATS 15 000 000 15 000 000
Purpose: Assistance and services Share 100% 100%
Belgium
Société Belge d’Assistance Internationale S.A., Bruxelles Share capital in EUR 7 709 000 7 709 000
Purpose: Insurance Share 94.10% 94.10%
Société Belge de Services Téléphoniques S.A., Bruxelles Share capital in EUR 74 400 74 400
Purpose: Services Share 94.39% 94.39%
Czech Republic
ELVIA Assistance s.r.o., Prague Share capital in CZK 30 000 000 30 000 000
Purpose: Services Share 100% 100%
France
Mondial Assistance Réunion S.A., Saint Denis (Reunion Island) Share capital in EUR 329 008 329 008
Purpose: Services Share 99.86% 99.86%
Gestion de Télésécurité et de Services S.A., Chatillon Share capital in EUR 720 000 720 000
Purpose: Services Share 99.86% 99.86%
France Secours International Assistance S.A., Bagnolet Share capital in EUR 2 745 000 2 745 000
Purpose: Services Share 90.98% 90.98%
FS2A S.A., Paris Share capital in EUR 10 775 000 37 000
Purpose: Insurance Share 90.98% 90.97%
Mondial Assistance France S.A., Paris Share capital in EUR 7 916 400 7 916 400
Purpose: Services Share 93.24% 93.24%
Fragonard Assurance S.A., Paris Share capital in EUR 25 037 000 37 000
Purpose: Insurance Share 93.24% 93.23%
Mondial Assistance S.A.S, Paris Share capital in EUR 20 088 900 20 088 900
Purpose: Holding Share 99.99% 99.99%
SACNAS International S.A., Paris Share capital in EUR 7 959 936 7 959 936
Purpose: Holding Share 99.88% 99.88%
SAGE S.A., Chatillon Share capital in EUR 22 500 22 500
Purpose: Services Share 99.86% 99.86%
Société Européenne de Protection et de Services d’Assistance à Domicile S.A., Paris Share capital in EUR 174 750 174 750
Purpose: Security and others Share 55.94% 55.94%
Société de Services Communs, Paris Share capital in EUR 221 067 221 067
Purpose: Services Share 95.14% 95.14%
Notes to the consolidated financial statements
Valuation reserve securities
in thousand EUR 2005 2004
Fixed-income securities and other investments
Cost 511 099 452 391
Fair value 519 158 460 931
Revaluation reserve 8 059 8 540
Shares
Cost 17 16
Fair value 22 20
Revaluation reserve 5 4
Intangible and tangible assets
in thousand EUR intangible assets tangible assets real estate Total
Balance value on December 31st, 2004 31 993 38 061 7 914 77 968
Exchange rate change 2 346 1 613 0 3 959
Additions 11 556 23 320 0 34 876
Change scope of consolidation 2 735 422 0 3 157
Disposals -3 235 -19 931 0 -23 166
Depreciations -6 626 -2 631 221 -9 036
Balance value on December 31st, 2005 38 769 40 854 8 135 87 758
Real Estate
The capitalised cost of buildings is calculated on the basis of acquisition cost and depreciation over a maximum of 50 years in
accordance with the useful life of the real estate. The gross capitalised values totalled 18.357 million Euros at the beginning of the
year and 18.639 million Euros at the end of the year. Accumulated depreciation amounted to 10.443 million Euros at the
beginning of the year and 10.504 million Euros at the end of the year. No unscheduled depreciation was recorded in 2005.
Tangible Assets
Tangible assets such as equipment, vehicles and hardware are depreciated over 3 to 10 years according to their useful lifes.
The gross capitalised values totalled 109.041 million Euros at the beginning of the year and 112.995 million Euros at the end of
the year. Accumulated depreciation amounted to 70.981 million Euros at the beginning of the year and 72.141 million Euros at
the end of the year. Expenditures to restore the future economic benefits from the assets are capitalised if they extend the useful life
of the asset, otherwise they are recognised as an expense.