ADP 2014 Annual Report Download - page 17
Download and view the complete annual report
Please find page 17 of the 2014 ADP annual report below. You can navigate through the pages in the report by either clicking on the pages listed below, or by using the keyword search tool below to find specific information within the annual report.-
 1
1 -
2
-
3
-
4
-
5
-
6
-
 7
7 -
 8
8 -
 9
9 -
 10
10 -
 11
11 -
 12
12 -
 13
13 -
 14
14 -
 15
15 -
 16
16 -
 17
17 -
 18
18 -
 19
19 -
 20
20 -
 21
21 -
 22
22 -
 23
23 -
 24
24 -
 25
25 -
 26
26 -
 27
27 -
28
-
29
-
30
-
31
-
32
-
33
-
34
-
35
-
36
-
37
-
38
-
39
-
40
-
41
-
42
-
43
-
44
-
45
-
46
-
47
-
48
-
49
-
50
-
51
-
52
-
53
-
54
-
55
-
56
-
57
-
58
-
59
-
60
-
61
-
62
-
63
-
64
-
65
-
66
-
67
-
68
-
69
-
70
-
71
-
72
-
73
-
74
-
75
-
76
-
77
-
78
-
79
-
80
-
81
-
82
-
83
-
84
-
85
-
86
-
87
-
88
-
89
-
90
-
91
-
92
-
93
-
94
-
95
-
96
-
97
-
98
 |
 |

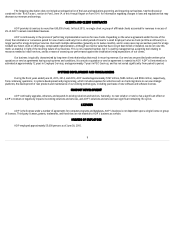
Issuer Purchases of Equity Securities
Period
Total Number of Shares
Purchased (1)
Average Price Paid
per Share
Total Number of Shares
Purchased as Part of the
Publicly Announced
Common Stock Repurchase
Plan (2)
Maximum Number of
Shares that may yet be
Purchased under the
Common Stock
Repurchase Plan (2)
April 1, 2015 to
April 30, 2015 1,575,000 $85.54 1,575,000 30,648,143
May 1, 2015 to
May 31, 2015 1,787,870 $86.70 1,785,903 28,862,240
June 1, 2015 to
J une 30, 2015 4,920,344 $84.07 1,556,085 27,306,155
Total 8,283,214
4,916,988
(1)
Pursuant to the terms of the Company’s restricted stock program, the Company purchased 3,356 shares at the then market value of the shares in
connection with the exercise by employees of their option under such program to satisfy certain tax withholding requirements through the
delivery of shares to the Company instead of cash
(2)
The Company received the Board of Directors' approval to repurchase shares of the Company's common stock as follows:
Date of Approval
Shares
March 2001
50 million
November 2002
35 million
November 2005
50 million
August 2006
50 million
August 2008
50 million
June 2011
35 million
August 2014
30 million
There is no expiration date for the common stock repurchase plan.
Performance Graph
The following graph compares the cumulative return on the Company’s common stock (a) for the most recent five years with the cumulative return on the
S&P 500 Index, a Peer Group Index (b) and the Old Peer Group Index (c) , assuming an initial investment of $100 on June 30, 2010, with all dividends reinvested.
As a result of the Company’s deepening focus on human capital management, the Company reassessed its peer group. We have determined that the companies
included in the S&P 500 Information Technology Index more closely match our Company characteristics than the companies previously included in the Old Peer
Group Index. The stock price performance shown on this graph may not be indicative of future performance.
16