Yamaha 2015 Annual Report Download - page 12
Download and view the complete annual report
Please find page 12 of the 2015 Yamaha annual report below. You can navigate through the pages in the report by either clicking on the pages listed below, or by using the keyword search tool below to find specific information within the annual report.-
 1
1 -
 2
2 -
 3
3 -
 4
4 -
 5
5 -
 6
6 -
 7
7 -
 8
8 -
 9
9 -
 10
10 -
 11
11 -
 12
12 -
 13
13 -
 14
14 -
 15
15 -
 16
16 -
 17
17 -
 18
18 -
 19
19 -
 20
20 -
 21
21 -
 22
22 -
23
-
24
-
25
-
26
-
27
-
28
-
29
-
30
-
31
-
32
-
33
-
34
-
35
-
36
-
37
-
38
-
39
-
40
-
41
-
42
-
43
-
44
-
45
-
46
-
47
 |
 |

We will enhance the earnings power of existing businesses to maintain and
strengthen our stable financial foundation.
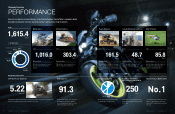
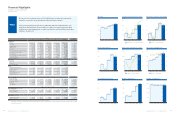
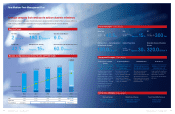
The fundamental financial strategy of the new MTP is to enhance the earnings power of existing businesses, and use this stable
financial foundation as a source of new investments for growth and increased returns to shareholders. The plan sets financial
targets for 2018 of a shareholders’ equity ratio of 42.5%, an average ROE of 15% over the three-year period, a dividend payout
ratio of 30%, and earnings per share (EPS) of at least ¥300. It also stresses management’s awareness of marginal profit,
investment efficiency, and business efficiency.
What is Yamaha’s financial strategy under the new MTP?
Q3
A
Financial Strategies
2013-2015 2016-2018
Increasing the earnings power of existing businesses (marginal profit, investment efficiency, business efficiency),
while creating a stable financial foundation and increasing new growth investment and stock dividends
Stock dividends
Working capital
increase/decrease
(including financial
credits)
Net income
Depreciation
expenses
Net income
Depreciation
expenses
Investment in
existing businesses
Stock dividends
Growth investment
Working capital
increase/decrease
(including financial
credits)
Investment in
existing businesses
Equity ratio 37.6% 42.5%
Shareholders’ equity ¥490.8 billion ¥700.0 billion
ROE (average) 13.9% Approx. 15%
Dividend payout ratio 20-26% Approx. 30%
EPS ¥172 ¥300 or more
While further strengthening earnings
power, using a stable financial
foundation as a foothold for
proactive investment in resources
for new growth strategies.
Yamaha Motor Co., Ltd. Annual Report 2015 Yamaha Motor Co., Ltd. Annual Report 2015
20 21