Yamaha 2015 Annual Report Download - page 11
Download and view the complete annual report
Please find page 11 of the 2015 Yamaha annual report below. You can navigate through the pages in the report by either clicking on the pages listed below, or by using the keyword search tool below to find specific information within the annual report.-
 1
1 -
 2
2 -
 3
3 -
 4
4 -
 5
5 -
 6
6 -
 7
7 -
 8
8 -
 9
9 -
 10
10 -
 11
11 -
 12
12 -
 13
13 -
 14
14 -
 15
15 -
 16
16 -
 17
17 -
 18
18 -
 19
19 -
 20
20 -
 21
21 -
 22
22 -
23
-
24
-
25
-
26
-
27
-
28
-
29
-
30
-
31
-
32
-
33
-
34
-
35
-
36
-
37
-
38
-
39
-
40
-
41
-
42
-
43
-
44
-
45
-
46
-
47
 |
 |

Would you please summarize the results achieved under the previous
Medium-Term Management Plan (MTP)?
We recovered the Yamaha Motor Group’s original level of performance and
earnings power.
The previous MTP (2013–2015) set management targets of ¥1,600.0 billion in net sales with operating income of ¥80.0 billion (for
an operating income ratio of 5%). Working toward these targets, we strengthened Yamaha’s product competitiveness, incorporated
changes to our Monozukuri,* carried out structural reforms, implemented growth strategies to reinforce our profit structure and
achieved cost reductions.
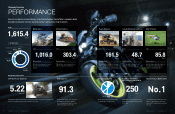
As a result of these efforts, in the fiscal year ended December 31, 2015, the final year under the plan, we achieved net sales of
¥1,615.4 billion with operating income of ¥120.4 billion, marking the third consecutive year of revenue and profit growth. Although
production volume for key products declined by roughly 600,000 units over the three-year period, sales rose on solid results in
developed markets and the introduction of higher-priced models in emerging markets. In addition, the market share grew for our
motorcycle business in markets except the Association of Southeast Asian Nations (ASEAN) region and our recreational off-highway
vehicles (ROVs) business, and the market share of large outboard motors increased for our marine products business. The 5%
operating income ratio target was achieved one year early, in 2014, and rose to 7.5% in 2015. Our financial position remained
stable, with return on equity (ROE) at 12.6% (16.7% excluding the effect of the APA**), a shareholders’ equity ratio of 37.6% (a 2.5
percentage-point improvement from the previous fiscal year-end), net income per share of ¥171.88 (¥232.59 excluding the effect
of the APA**), and market capitalization over ¥1 trillion.
In terms of both level of performance and earnings power, we are returning to the levels of 2007 when the Group recorded
record high profit. Going forward, we will pursue the next round of management reforms with the aim of further dynamic growth.
* An approach to engineering, manufacturing and marketing products that emphasizes craftsmanship and excellence
** Advance Pricing Agreement – prior approval related to taxation on transfer pricing
We are aiming for new growth with net sales of ¥2 trillion and a 10%
operating income ratio.
During the three years under the previous MTP, developed markets remained solid but there was a sense of weakening in emerging
markets, and by successfully recalibrating the relative positions of the developing and emerging market businesses, results
recovered to the levels recorded prior to the 2008 global financial crisis, and we were able to build a stable financial foundation to
support continuous growth.
For the next three years under the new MTP (2016-2018), we expect economic conditions to remain solid in developed
markets and to recover in some emerging markets. Based on these assumptions, we are positioning 2018, the final year of the new
MTP, as the year for having laid the groundwork for new growth to realize the next milestone, with net sales of ¥2 trillion and
¥180.0 billion in operating income (for a 10% operating income ratio).
To achieve this, over the next three years we will work to enhance the earnings power of existing businesses even further, by
maintaining the strength of the motorcycle, marine products, and recreational vehicles (RVs) businesses in developed markets, and
increasing earnings in emerging markets with a focus on Indonesia, India, and Vietnam. While continuing to reduce costs and
implement structural reforms to maintain and strengthen our stable financial foundation, we will use the stable earnings generated
by existing businesses to invest in new growth strategies.
Q1
A
What management targets does the new MTP set?
NEW GROWTH, NEW MILESTONES
INTERVIEW
WITH THE PRESIDENT
Q2
A
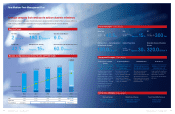
Net Sales / Operating Income Plan for FY2018 Net Sales and Operating Income
2007
($117/€156)
1,756.7
127.0
7.2%
2012
($80/€103)
1,207.7
18.6
1.5%
2013
($98/€130)
1,410.5
55.1
3.9%
2014
($106/€140)
1,521.2
87.2
5.7%
2015
($121/€134)
1,615.4
120.4
7.5%
Net Sales Operating Income
2015
Result
1,615.4
2,000.0
2018
MTP
Net Sales +350.0 (+21%) Operating Income +55.0 (+44%)
2015
Result
120.4
7.5%
180.0
2018
MTP
9.0%
Developed markets: Steady conditions to continue
Emerging markets: Recovery and expansion expected
in three markets
Increasing the earnings power of existing
businesses, and investing resources in
new growth strategies
Net Sales Operating Income
(Billion ¥) (Billion ¥)
Yamaha Motor Co., Ltd. Annual Report 2015 Yamaha Motor Co., Ltd. Annual Report 2015
18 19