Wacom 2013 Annual Report Download - page 13
Download and view the complete annual report
Please find page 13 of the 2013 Wacom annual report below. You can navigate through the pages in the report by either clicking on the pages listed below, or by using the keyword search tool below to find specific information within the annual report.-
 1
1 -
2
-
 3
3 -
 4
4 -
 5
5 -
 6
6 -
 7
7 -
 8
8 -
 9
9 -
 10
10 -
 11
11 -
 12
12 -
 13
13 -
 14
14 -
 15
15 -
 16
16 -
 17
17 -
 18
18 -
 19
19 -
 20
20 -
 21
21 -
 22
22 -
 23
23 -
24
 |
 |

Current assets -
Cash and deposits (Note 9)
Notes and accounts receivable-trade (Note 5)
Merchandise and finished goods (Note 2)
Work in process (Note 2)
Raw materials and supplies (Note 2)
Accounts receivable-other
Deferred tax assets
Others
Allowance for doubtful accounts (Note 2)
Total current assets
Noncurrent assets -
Property, plant and equipment: (Note 2)
Buildings and structures
Accumulated depreciation
Buildings and structures, net
Machinery, equipment and vehicles
Accumulated depreciation
Machinery, equipment and vehicles, net
Tools, furniture and fixtures
Accumulated depreciation
Tools, furniture and fixtures, net
Land
Total property, plant and equipment
Intangible assets:
Goodwill (Note 2)
Others
Total intangible assets
Investments and other assets:
Investment securities (Note 2)
Deferred tax assets
Others
Allowance for doubtful accounts (Note 2)
Total investments and other assets
Total noncurrent assets
Total assets
Wacom Co., Ltd. and Its Subsidiaries
Consolidated Balance Sheets
The accompanying notes are an integral part of these financial statements.
24
Assets:
¥11,969,873
7,174,64 0
3,887,185
377,985
812,756
1,521,961
1,107,663
654,433
(16,480)
27,490,016
3,542,535
(1,965,429)
1,577,106
199,974
(131,317)
68,657
2,230,773
(1,694,893)
535,880
1,435,469
3,617,112
46,905
2,430,256
2,477,161
195,115
13,786
352,069
(15,861)
545,109
6,639,382
¥34,129,398
$229,627
112,724
39,788
4,540
13,974
31,439
13,066
9,594
(188)
454,564
39,689
(21,332)
18,357
2,504
(1,385)
1,119
31,990
(19,974)
12,016
15,397
46,889
269
25,330
25,599
2,327
264
3,512
(202)
5,901
78,389
$532,953
March 31 March 31
Thousands of yen
Thousands of
U.S. dollars
(Note 1)
2013 20132012
¥21,596,429
10,601,728
3,742,068
426,982
1,314,261
2,956,854
1,228,865
902,267
(17,686)
42,751,768
3,732,734
(2,006,283)
1,726,451
235,458
(130,185)
105,273
3,008,664
(1,878,545)
1,130,119
1,448,067
4,409,910
25,257
2,382,308
2,407,565
218,869
24,788
330,330
(19,037)
554,950
7,372,425
¥50,124,193
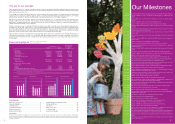
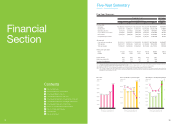
Our financial position
Total assets as of March 31, 2013 increased by ¥15,995 mil-
lion to ¥50,124 million compared to the end of the previous
fiscal year. The main factors increasing assets were
increases of ¥9,627 million in cash and cash equivalents,
¥3,427 million in notes and accounts receivable and ¥1,435
million in accrued revenue due to the launch of new products
and business growth.
Total liabilities as of March 31, 2013 increased by ¥5,701 mil-
lion to ¥20,913 million compared to the end of the previous
fiscal year, due to ¥3,511 million in notes and accounts pay-
able and ¥828 million in income tax payable due to the
launch of new products and business growth.
Total net assets increased by ¥10,294 million to ¥29,212 mil-
lion, due to ¥4,770 million in net profit and ¥5,611 million in
disposal of treasury stock for allocation to a third party, and
the issuance of new shares through execution of subscrip-
tion rights. Factors decreasing net assets included a ¥1,193
million dividend payment.
Consolidated cash and cash equivalents for the fiscal period
ended March 31, 2013 totaled ¥21,596 million, an increase of
¥9,627 million from the end of the previous fiscal year
(compared to a ¥1,515 million increase over the previous
fiscal period).
(Cash Flow from Operating Activities)
Cash gained in operating activities during the fiscal period
ended March 31, 2013 was ¥5,895 million (compared to
¥4,881 million generated in the previous fiscal period). The
increase was due to a ¥7,546 million increase in net profit
before tax and a ¥3,298 increase in accounts payable,
despite a ¥4,583 million increase in accounts receivable.
(Cash Flow from Investing Activities)
Cash flow from investing activities during the fiscal period
ended March 31, 2013 was ¥1,611 million (compared to
¥1,697 million used in the previous fiscal period), due primar-
ily to a ¥965 million acquisition of fixed assets such as molds
and a ¥588 million acquisition of ERP system software.
(Cash Flow from Financing Activities)
Cash flow used in financing activities during the fiscal period
ended March 31, 2013 was ¥4,337 million (compared to
¥1,627 million used in the previous fiscal period). The
primary contributing factors were ¥5,527 million for disposal
of treasury stock for allocation to third party and the issu-
ance of new shares through execution of subscription rights
and despite a decrease from a ¥1,190 million payment of
dividends to shareholders.
(For the years ended March 31)
0
1,000
2,000
Cash Dividends per Share / Payout Raito
’09 ’10 ’11
Cash Dividends per share(yen)
Pay out Raito(%)
60.7
3,000
60
50
40
30
20
10
48.3
3,000
61.2
3,000
3,000
4,000
’12
54.9
3,000
’13
37.7
4,500
(Millions of yen)
(Millions of yen)
’09 ’10
’09 ’10
’09 ’10 ’11 ’12
’11 ’12
(For the years ended March 31)
(For the years ended March 31)
(For the years ended March 31)
Cash f lows from operating activities
Cash f lows from investing activities
(Millions of yen)
-3,000
-2,000
-1,000
0
1,000
2,000
3,000
4,000
Cash f lows from f inancing activities
-2,676
-1,199
-1,174
-1,470
’11
-1,697
’12
-1,611
’13
-805
1,179
4,881
’13
5,895
1,478
3,606
-1,202
-1,627
’13
4,337
23
0
1,000
2,000
3,000
4,000
5,000
6,000
-2
,
000
-1
,
500
-1
,
000
-500
0