Wacom 2013 Annual Report Download - page 12
Download and view the complete annual report
Please find page 12 of the 2013 Wacom annual report below. You can navigate through the pages in the report by either clicking on the pages listed below, or by using the keyword search tool below to find specific information within the annual report.-
 1
1 -
 2
2 -
 3
3 -
 4
4 -
 5
5 -
 6
6 -
 7
7 -
 8
8 -
 9
9 -
 10
10 -
 11
11 -
 12
12 -
 13
13 -
 14
14 -
 15
15 -
 16
16 -
 17
17 -
 18
18 -
 19
19 -
 20
20 -
 21
21 -
 22
22 -
23
-
24
 |
 |

(For the years ended March 31)
(For the years ended March 31)
(For the years ended March 31)
(For the years ended March 31)
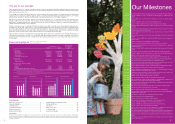
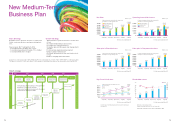
Overview of Business Performance
Wacom Co., Ltd. and Its Subsidiaries
’12 28,507
29,406
’13
(Millions of yen)
(Millions of yen)
Sales
Operating
income
Brand Business
UP 3.2%
DOWN 4.5%
5,125
4,895
’12
’13
Operating
income
Operating
income
1,091
5,554
’12
’13
2012
¥40,706
Sales Breakdown by Business
31,056
11,683
’13
’12
(Millions of yen)
(Millions of yen)
Sales
Component Business
UP 165.8%
UP 409.3%
1.0%
Brand Business %
2013
¥61,068
Other Business 1.3%
Component Business 28.7%
Component Business 50.9%
48.1
Our results by business sector
Brand business
In the Brand business, sales increased as a result of robust growth
in the Cintiq series and strong sales of our Bamboo Stylus series.
Overall business growth, however, was limited by various factors
including the delay new product launches and a stagnated market.
In Professional Products, sales grew thanks to the well-received
launches of Cintiq 24HD touch and Cintiq 22HD in July. Both of
them feature a wide format and full HD resolution display. Cintiq
13HD, announced in March, was well received by the market, how-
ever, due to the launch delay, results are not included in the current
consolidated fiscal period. Sales of Intuos5, our professional pen
tablet, did not achieve the same level of sales as the previous fiscal
year due to inventory overhang of previous model in the beginning
of the current fiscal year, a shift in demand to Cintiq series, and the
slow sales through major retail partners in U.S.
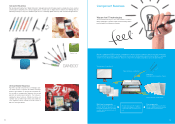
In Consumer Products, the Bamboo Stylus duo for touch screens
and paper was released in April, and the pocket-sized Bamboo
Stylus pocket for touch screens was launched in September. Over-
all sales of Consumer Products progressed favorably, supported by
increasing sales in the Bamboo Stylus series and existing pen
tablet models. In December, the Bamboo Stylus feel incorporating
our EMR pen sensor technologies joined the Bamboo Stylus family.
In Business Products, sales decreased due to poor sales of prod-
ucts in non-signature categories, although the STU series of LCD
signature tablets generated favorable sales in Japan and Europe.
Looking at sales by region, in the U.S., sales remained broadly in
line with the previous fiscal year owing to the off-set of an increase
in Consumer Products against a decrease in Business Products. In
Europe, sales increased supported by favorable performance of
Bamboo Stylus series and STU series and despite an appreciation
of the yen against the Euro and a sluggish economy in South
Europe. In Japan, sales were slightly lower than the previous fiscal
year as the Intuos5 sales fell short of expectations and Business
Products sales decreased despite favorable sales of the Cintiq
series. In Asia and Oceania, sales in China decreased due to grow-
ing anti-Japanese sentiment. Regional sales as a whole decreased
despite favorable growth of the Cintiq series and Bamboo Stylus
series due to sluggish sales of other products.
As a result of the above, sales in the Brand business category for
the fiscal year ended March 31, 2013 increased 3.2% to ¥29,406
million, with operating profit decreasing 4.5% to ¥4,895 million.
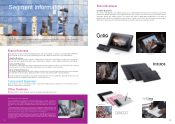
Component business
Sales during the fiscal period under review increased significantly,
primarily due to commercial production of Wacom’ s pen sensor
system. The component was adopted by Samsung for its Galaxy
Note 8.0 tablet in February, in addition to the Galaxy Note 10.1
tablet released in August and the Galaxy Note II, a new generation
smartphone launched last October. As for tablets and notebook
PCs on Windows 8, our pen sensor system was regularly adopted
by major PC manufacturers and has gained new customers such as
Dell etc.
Reflecting the above initiatives and outcomes, sales in the Compo-
nent business category for the fiscal period under review increased
165.8% to ¥31,056 million, while operating profit increased 409.3%
to ¥5,554 million.
Other business
In the Software business, sales increased owing to improved oper-
ating efficiency arising from stronger partnerships with major
distributors, and to securing new projects.
As a result of the above, sales in the Other business category for
the fiscal period under review increased 17.5% to ¥606 million, with
operating profit increasing 46.0% to ¥102 million.
606
’13
516
’12
Sales
Other Business
UP 17.5%
UP 46.0%
102
’13
70
’12
Other Business
22
Brand Business 70.0%
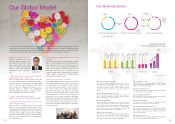
Overview of Business Performance
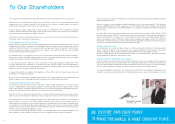
How did the global economy affect
our business in our 30th year?
Wacom Co., Ltd. and Its Subsidiaries
Despite support in the domestic economy from reconstruc-
tion demand following the Great East Japan Earthquake, in
the current fiscal year (April 1, 2012 to March 31, 2013),
growth slowed in the U.S. due to the prolonged debt problem
in Europe and growing anti-Japanese sentiment in China.
With regard to forex, the yen further strengthened temporarily
in the middle of the fiscal year; however the trend reversed
due to the expectation of monetary policy easing by the cen-
tral bank following the new government starting in Japan in
late 2012. Meanwhile, in the IT industry, there was a rapid
growth in new product categories including smartphones and
tablets. Manufacturers ramped up efforts to grow market
share as global OS makers developed and launched hard-
ware.
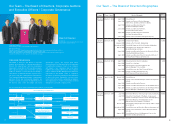
In markets where Wacom Group participates, a number of
trends have become evident.
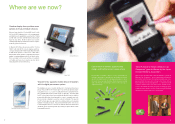
In Professional Products, we are seeing increased adoption of
3D technologies for industrial design by the automobile and
home appliance industries, and usage for content creation in
the movie and game industries. In Consumer Products, we
are seeing a growing need for intuitive input-by-hand func-
tions following an increase in tablets and e-book devices. We
are also seeing increased demand in traditional uses such as
illustrations, photo retouching and web design. In Business
Products, use of LCD pen tablet products is increasing with a
growing demand for security improvement and paperless
environments across a broad range of sectors, including
pharmaceuticals, education and finance. Electronic settle-
ment using digital signatures, in particular, is gaining attention
as a remarkably effective way to improve information security
and operational efficiency, while reducing document manage-
ment costs. In our Component business, we are seeing
increased utilization of pen or multi-touch technologies in
smartphones, tablets and e-book readers using Android OS.
Moreover, Samsung’ s Galaxy Note Series, the models of
smartphones and tablets incorporating our pen technologies,
have increased and established a new high-growth category.
In addition, PC manufacturers launched new tablets based on
Windows 8, Microsoft’s next generation OS.
Against this background, Wacom Group aimed for further
growth through active online marketing and sales activities,
developing new products, expanding the product lineup for
tablet devices and strengthening the development systems
for pen applications. We also focused on enhancing our SCM
system in Shanghai, China, developing a new ERP system in
Asia and Oceania. The Company has announced its new
medium-term business plan, “WAP1215” (FY March, 2014 to
FY March, 2016), that aims to grow the business and enhance
corporate value. According the new business plan, Wacom
will strive to achieve consolidated net sales of ¥120 billion or
more, an operating profit margin of 15% or more, and ROE of
30% or more by FY March, 2016.
As a result, consolidated net sales increased 50.0% to
¥61,068 million, operating profit increased 94.6% to ¥7,915
million, ordinary profit increased 94.2% to ¥7,559 million and
net profit increased 118.7% to ¥4,770 million.
0
10
5
15
20
25
30
0
5
10
15
20
25
30
40
50
60
70
80
(Yen)
(%)
(%)
’09 ’10 ’11 ’12 ’13
’09 ’10 ’11 ’12
’09 ’10 ’11 ’12
(For the years ended March 31)
(For the years ended March 31)
(For the years ended March 31)
Net income per share (basic)
ROE/ROA
Equity ratio
12.24 13.66
’13
29.81
15.53
12.25
10.7
7.1
11.7
7.1
14.2
10.9
7.3
9.4
68.1
69.4
64.8
Note: ROA equals net income/average total assets.
55.2
’13
58.1
21
(ROE)
(ROA)
19.9
11.3