Vectren 2012 Annual Report Download - page 7
Download and view the complete annual report
Please find page 7 of the 2012 Vectren annual report below. You can navigate through the pages in the report by either clicking on the pages listed below, or by using the keyword search tool below to find specific information within the annual report.-
 1
1 -
 2
2 -
 3
3 -
 4
4 -
 5
5 -
 6
6 -
 7
7 -
 8
8 -
 9
9 -
 10
10 -
 11
11 -
 12
12 -
 13
13 -
 14
14 -
 15
15 -
 16
16 -
 17
17 -
 18
18 -
19
-
20
-
21
-
22
-
23
-
24
-
25
-
26
-
27
-
28
-
29
-
30
-
31
-
32
-
33
-
34
-
35
-
36
-
37
-
38
-
39
-
40
-
41
-
42
-
43
-
44
-
45
-
46
-
47
-
48
-
49
-
50
-
51
-
52
-
53
-
54
-
55
-
56
-
57
-
58
-
59
-
60
-
61
-
62
-
63
-
64
-
65
-
66
-
67
-
68
-
69
-
70
-
71
-
72
-
73
-
74
-
75
-
76
-
77
-
78
-
79
-
80
-
81
-
82
-
83
-
84
-
85
-
86
-
87
-
88
-
89
-
90
-
91
-
92
-
93
-
94
-
95
-
96
-
97
-
98
-
99
-
100
-
101
-
102
-
103
-
104
-
105
-
106
-
107
-
108
-
109
-
110
-
111
-
112
-
113
-
114
-
115
-
116
-
117
-
118
-
119
-
120
-
121
-
122
-
123
-
124
-
125
-
126
-
127
-
128
-
129
-
130
-
131
-
132
 |
 |

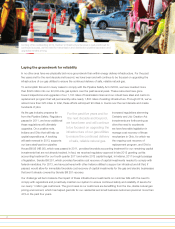
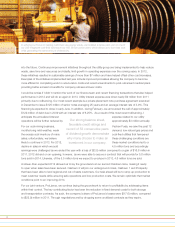
For Energy Systems Group (ESG), currently the sole company in
our Energy Services division, energy efficiency and sustainability are
at the very core of its existence. 2012 was another successful year
in reaching agreements with a diverse set of customers to conduct
energy efficiency upgrades and improvements of their facilities
through performance contracting, including a $57 million Chicago
naval base contract signed as a joint project with a partner firm. Other
key projects were brought to fruition in 2012, including a $13 million
project to upgrade a Michigan prison system with improvements in
heating, air and lighting equipment and water conservation measures.
However, ESG, as expected, continued to see financial performance
that was relatively flat with 2012 earnings of $5.7 million compared
to $6.7 million in 2011. Recently, results at ESG have been lower as
the company has been focused on investing in human capital to lay
the groundwork for future growth given our nation’s focus on energy
efficiency and cost-saving measures. Furthermore, the company
has been hampered by the delayed action of many of its potential
customers who have declining tax bases and accordingly, shrinking
budgets. Even though ESG’s projects are self-funding, some
customers have been hesitant to fully execute on multi-million dollar
contracts for capital improvements given the perception and political
pressures sometimes experienced with these endeavors as other
costs are cut.
On a positive note, ESG’s renewable energy projects continue to
receive national attention in setting examples of sustainability for
others to emulate. The company has now developed five landfill-
gas-to-energy projects, with another to be constructed in Georgia
in 2013. Plus, ESG cut the ribbon on three anaerobic digesters in
Wisconsin in 2012, creating the ability for three dairy farms to convert
cattle waste to power. In the coming years, we firmly believe ESG is
primed to begin seeing a return on investment made in its workforce,
whereby the performance contracting business will see improved
results. Furthermore, we believe the ability to develop renewable
energy projects will see continued penetration as well given the
number of states and utilities with renewable energy portfolio goals.
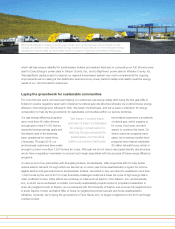
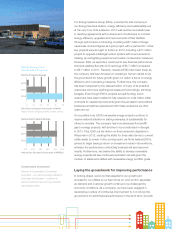
Laying the groundwork for improving performance
In looking ahead, we know that essential to our growth and
success for our utilities is our keen focus on cost control, especially
as demand and customer growth continue to be challenged by
economic conditions. As a company, we have been engaged in
developing a culture of continuous improvement to not only lay the
groundwork for solid financial performance in the short term, but well
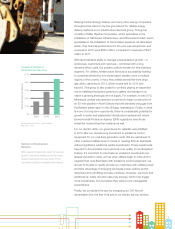
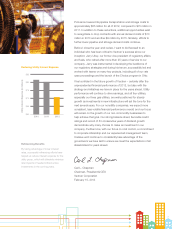
Conservation Connection
Vectren’s Conservation Connection
programs – our various energy efficiency
incentives and rebates – continue to
perform well and have strong customer
participation rates.
Energy Savings from
Conservation Programs
Figures include
Energizing Indiana
program savings.
Electric Program Savings
0 10 20 30 40 50
2010
2011
2012
Electricity Savings (in thousands of MWh)
Natural Gas Program Savings
375 400 425 450 475 500
2010
2011
2012
Natural Gas Savings (in thousands of MMBtu)
5