Vectren 2012 Annual Report Download - page 3
Download and view the complete annual report
Please find page 3 of the 2012 Vectren annual report below. You can navigate through the pages in the report by either clicking on the pages listed below, or by using the keyword search tool below to find specific information within the annual report.-
 1
1 -
 2
2 -
 3
3 -
 4
4 -
 5
5 -
 6
6 -
 7
7 -
 8
8 -
 9
9 -
 10
10 -
 11
11 -
 12
12 -
 13
13 -
 14
14 -
15
-
16
-
17
-
18
-
19
-
20
-
21
-
22
-
23
-
24
-
25
-
26
-
27
-
28
-
29
-
30
-
31
-
32
-
33
-
34
-
35
-
36
-
37
-
38
-
39
-
40
-
41
-
42
-
43
-
44
-
45
-
46
-
47
-
48
-
49
-
50
-
51
-
52
-
53
-
54
-
55
-
56
-
57
-
58
-
59
-
60
-
61
-
62
-
63
-
64
-
65
-
66
-
67
-
68
-
69
-
70
-
71
-
72
-
73
-
74
-
75
-
76
-
77
-
78
-
79
-
80
-
81
-
82
-
83
-
84
-
85
-
86
-
87
-
88
-
89
-
90
-
91
-
92
-
93
-
94
-
95
-
96
-
97
-
98
-
99
-
100
-
101
-
102
-
103
-
104
-
105
-
106
-
107
-
108
-
109
-
110
-
111
-
112
-
113
-
114
-
115
-
116
-
117
-
118
-
119
-
120
-
121
-
122
-
123
-
124
-
125
-
126
-
127
-
128
-
129
-
130
-
131
-
132
 |
 |

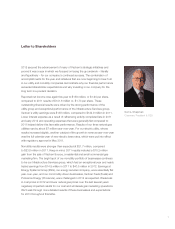
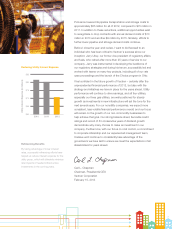
Carl L. Chapman
Chairman, President & CEO
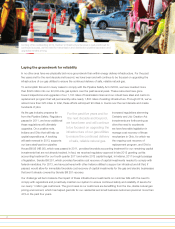
2012 secured the advancement of many of Vectren’s strategic initiatives and
proved it was a year in which we focused on laying the groundwork – literally
and figuratively – for our company’s continued success. The combination of
accomplishments for the year and initiatives that are now beginning to bear fruit
in our utility and nonutility companies demonstrate why our financial performance
exceeded shareholder expectations and why investing in our company for the
long term is a prudent decision.
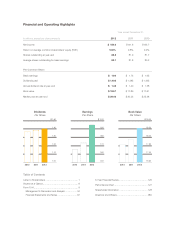
Reported net income rose again this year to $159 million, or $1.94 per share,
compared to 2011 results of $141.6 million or, $1.73 per share. These
outstanding financial results were driven by the strong performance of the
utility group and exceptional performance of the Infrastructure Services group.
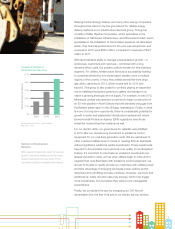
Vectren’s utility earnings were $138 million, compared to $122.9 million in 2011.
Lower interest expense as a result of refinancing activity completed late in 2011
and early 2012 and operating expenses that were generally flat compared to
2011 helped deliver this favorable performance. Results of our three natural gas
utilities rose by about $7 million year-over-year. For our electric utility, whose
results increased slightly, another catalyst of the growth in revenue year-over-year
was the full calendar year of new electric base rates, which were put into effect
with regulatory approval in May 2011.
Nonutility results were stronger than expected at $21.7 million, compared
to $23.8 million in 2011. Keep in mind, 2011 results included a $15.2 million
gain from the sale of Vectren Source, a residential and small commercial gas
marketing firm. The bright spot of our nonutility portfolio of businesses continues
to be our Infrastructure Services group, which had an exceptional year and nearly
tripled earnings from $14.9 million in 2011 to $40.5 million in 2012. Earnings at
Energy Systems Group (ESG), our energy services company, were essentially flat
year-over-year, and our commodity-driven businesses, Vectren Fuels (Fuels) and
ProLiance Energy (ProLiance), were challenged in 2012 as expected. Weakness
in coal prices in 2012 and lower natural gas prices over the last several years
negatively impacted results for our coal and wholesale gas marketing operations.
We’ll walk through more detailed results of these businesses and expectations
for 2013 throughout this letter.
Letter to Shareholders
1