United Technologies 2008 Annual Report Download - page 6
Download and view the complete annual report
Please find page 6 of the 2008 United Technologies annual report below. You can navigate through the pages in the report by either clicking on the pages listed below, or by using the keyword search tool below to find specific information within the annual report.-
 1
1 -
 2
2 -
 3
3 -
 4
4 -
 5
5 -
 6
6 -
 7
7 -
 8
8 -
 9
9 -
 10
10 -
 11
11 -
 12
12 -
 13
13 -
 14
14 -
 15
15 -
 16
16 -
 17
17 -
18
-
19
-
20
-
21
-
22
-
23
-
24
-
25
-
26
-
27
-
28
-
29
-
30
-
31
-
32
-
33
-
34
-
35
-
36
-
37
-
38
-
39
-
40
-
41
-
42
-
43
-
44
-
45
-
46
-
47
-
48
-
49
-
50
-
51
-
52
-
53
-
54
-
55
-
56
-
57
-
58
-
59
-
60
-
61
-
62
-
63
-
64
-
65
-
66
-
67
-
68
-
69
-
70
-
71
-
72
-
73
-
74
-
75
-
76
-
77
-
78
-
79
-
80
-
81
-
82
-
83
-
84
-
85
-
86
-
87
-
88
-
89
-
90
-
91
-
92
-
93
-
94
-
95
-
96
-
97
-
98
 |
 |

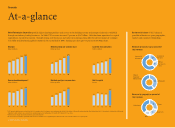
Revenues by geography as percent of
total revenues
Revenues by business type as percent of
total revenues
Revenues
Dollars in billions
17%
62% 21%
At-a-glance
Commercial
& Industrial
Commercial
Aerospace
Military
Aerospace &
Space
60%
40%
Original
Equipment
Manufacturing
Aftermarket
16%
36%
United States
Other
Asia Pacific
04
37.4
05
42.7
06
47.8
07
54.8
08
58.7
04
2.64
05
3.12(1)
06
3.71
07
4.27
08
4.90
04
3.6
05
4.3
06
4.8
07
5.3
08
6.2
04
2.9
05
2.8
06
3.2
07
3.6
08
3.8
04
0.70
05
0.88
06
1.02
07
1.17
08
1.35
04
28
05
33
06
31
07
30
08
42(3)
Diluted earnings per common share
Dollars per share
Cash flow from operations
Dollars in billions
Debt to capital
Percent
Dividends paid per common share
Dollars per share
Research and development(2)
Dollars in billions
United Technologies Corporation provides high technology products and services to the building systems and aerospace industries worldwide
through our industry-leading businesses. In 2008, UTC revenues increased 7 percent to $58.7 billion. Cash flow from operations less capital
expenditures exceeded net income. Strength in long cycle businesses and early restructuring actions offset the adverse impact of a stronger
U.S. dollar and deteriorating global economy in the second half of 2008. Earnings per share grew 15 percent to $4.90 per share.
Businesses in balance UTC’s balanced
portfolio of businesses spans geographies,
markets and customer relationships.
Financials
17%
31%
4United Technologies Corporation
Europe
(1) 2005 amount is diluted income per share before the $0.09 cumulative effect of a change in an accounting principle related to the adoption of Financial Accounting Standards Board Interpretation No. 47, “Accounting for Conditional Asset Retirement
Obligations,” which resulted in a non-cash after tax cumulative impact on the fourth quarter 2005 results of $95 million or $0.09 per share.
(2) Amounts include company- and customer-funded research and development.
(3) The increase in the 2008 debt to capitalization ratio includes net unrealized losses of approximately $4.2 billion due to the effect of market conditions on our pension plans.