Unilever 2006 Annual Report Download - page 3
Download and view the complete annual report
Please find page 3 of the 2006 Unilever annual report below. You can navigate through the pages in the report by either clicking on the pages listed below, or by using the keyword search tool below to find specific information within the annual report.-
 1
1 -
 2
2 -
 3
3 -
 4
4 -
 5
5 -
 6
6 -
 7
7 -
 8
8 -
 9
9 -
 10
10 -
 11
11 -
 12
12 -
 13
13 -
 14
14 -
15
-
16
-
17
-
18
-
19
-
20
-
21
-
22
-
23
-
24
-
25
-
26
-
27
-
28
-
29
-
30
-
31
-
32
-
33
-
34
-
35
-
36
-
37
-
38
-
39
-
40
-
41
-
42
-
43
-
44
-
45
-
46
-
47
-
48
-
49
-
50
-
51
-
52
-
53
-
54
-
55
-
56
-
57
-
58
-
59
-
60
-
61
-
62
-
63
-
64
-
65
-
66
-
67
-
68
-
69
-
70
-
71
-
72
-
73
-
74
-
75
-
76
-
77
-
78
-
79
-
80
-
81
-
82
-
83
-
84
-
85
-
86
-
87
-
88
-
89
-
90
-
91
-
92
-
93
-
94
-
95
-
96
-
97
-
98
-
99
-
100
-
101
-
102
-
103
-
104
-
105
-
106
-
107
-
108
-
109
-
110
-
111
-
112
-
113
-
114
-
115
-
116
-
117
-
118
-
119
-
120
-
121
-
122
-
123
-
124
-
125
-
126
-
127
-
128
-
129
-
130
-
131
-
132
-
133
-
134
-
135
-
136
-
137
-
138
-
139
-
140
-
141
-
142
-
143
-
144
-
145
-
146
-
147
-
148
-
149
-
150
-
151
-
152
-
153
 |
 |

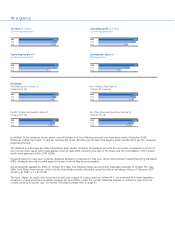
At a glance
In addition to the dividends shown above, one-off dividends of the following amounts per share were paid in December 2006:
€0.26 per ordinary NV share; 17.66p per ordinary PLC share; $0.3316 per NV New York Registry share; and $0.3372 per PLC American
Depositary Receipt.
The dividend and earnings per shareinformation given above, including comparative amounts for prior years, is expressed in terms of
the nominal share values which have applied since 22 May 2006, following the split of NV shares and the consolidation of PLC shares
which were approved at the 2006 AGMs.
Dividend figures for each year comprise dividends declared or proposed for that year. Under International Financial Reporting Standards
(IFRS), dividends are only recorded against the year in which they become payable.
Actual dividends payable for 2006 on Unilever N.V. New York Registry Shares and American Depositary Receipts of Unilever PLC may
differ from those shown above, which include final dividend values calculated using the rates of exchange ruling on 7 February 2007
(€1.00 = $1.2987, £1 = $1.9718).
The term ‘shares’ as used in this document should, with respect to shares issued by Unilever N.V., be construed to include depositary
receipts for shares issued by Foundation Unilever NV Trust Office, unless the context otherwise requires or unless it is clear from the
context that this is not the case. For further information please refer to page 41.
Turnover (€ million)
Continuing operations
Operating profit (€ million)
Continuing operations
5 408
5 074
3 981
39 642
38 401
37 168
2006
2005
2004
2006
2005
2004
Operating margin (%)
Continuing operations
Earnings per share (€)
Total operations
1.65
1.29
0.94
13.6
13.2
10.7
2006
2005
2004
2006
2005
2004
Dividends
47.66
45.13
42.56
0.70
0.66
0.63
2006
2005
2004
2006
2005
2004
0.9300
0.8238
0.7952
0.9037
0.8251
0.8084
2006
2005
2004
2006
2005
2004
Per Ordinary €0.16 share of
Unilever N.V. (€)
Per Ordinary 3
1
/
9
p share of
Unilever PLC (pence)
Per €0.16 New York Registry share of
Unilever N.V. ($)
Per 3
1
/
9
p American Depositary Receipt of
Unilever PLC ($)