Unilever 2006 Annual Report Download - page 19
Download and view the complete annual report
Please find page 19 of the 2006 Unilever annual report below. You can navigate through the pages in the report by either clicking on the pages listed below, or by using the keyword search tool below to find specific information within the annual report.
16 Unilever Annual Report and Accounts 2006
Report of the Directors (continued)
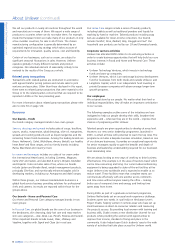
Operating review by region The Americas
2006 compared with 2005
Turnover at current rates of exchange rose by 4.6%, after the
impact of acquisitions, disposals and exchange rate changes as
set out in the table above. Operating profit at current rates of
exchange rose by 26.7%, after including a favourable currency
movement of 1.4%. The underlying performance of the business
after eliminating these exchange translation effects and the
impact of acquisitions and disposals is discussed below at
constant exchange rates.
Overall, we have maintained share in the US in markets which are
growing at around 3%. Underlying sales growth in the US was
2.4%, partly reflecting the effect of trade de-stocking in personal
care brands during the first half of the year and in ice cream in
the second half. Degree, Dove and Axe –our three main
deodorants brands – all gained share. The launch of Sunsilk
drove growth in haircare. In laundry we initiated the move to
concentrated liquids but have lost further share in conventional
detergents.
Bertolli frozen meals, Lipton ready-to-drink tea, in our joint
venturewith Pepsi, and Slim•Fast all gained sharein the US with
the latter making weight loss accessible, affordable and
achievable for consumers everywhere. Our sharefor the year as a
whole was also up in ice cream, although sales were down. The
sector has been heavily promoted in recent years but in 2006 the
level of promotional intensity reduced. As a result, the trade used
up stocks and bought less.
Sales in Brazil picked up well after a slow start, with very good
innovation-driven performances in hair, deodorants and laundry.
Indeed, Omo’sbrand sharewas at its highest level for many years.
Sales in Mexico werelower for the year,affected by a combination
of a decline in the traditional retail trade and local low-priced
competition. In addition, there were several operational issues
which have since been addressed. The business returned to
growth in the fourth quarter. Elsewhere there was good growth in
Argentina, Central America and Venezuela. Taken together, sales in
Latin America were ahead by 5.8% with Home and Personal Care
brands continuing to do well. However, there was more modest
growth in Foods brands due to tough local competition.
New products introduced in the US included Wish-Bone Salad
Spritzers with one calorie per spray,further development of the
Bertolli premium frozen meal range, and Lipton pyramid tea bags.
Across the region, new Knorr soups and bouillons cater for local
tastes. The highly successful AdeS nutritional drink has been
extended with a ‘light’ variant, new fruit flavours and the launch
of soymilk in Brazil and Mexico.
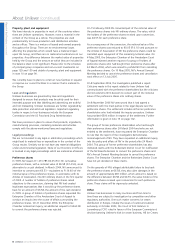
We strengthened our hair portfolio with the launch of Sunsilk,
improved both the Suave and Dove haircare lines and sold the
Aquanet and Finesse brands. Wehad a good sales response to
all Small & Mighty concentrated liquid detergents. These use
reduced-size packaging to save water,cardboard and energy use
in production, packaging and transport. They are also easier for
consumers to carry, pour and store. We then applied all Small &
Mighty’s product technology to fabric conditioners, creating
Snuggle Exhilarations – a three-times moreconcentrated premium
sub-range delivering superior fragrance. In Brazil, Omo has been
further strengthened with a new top-performance product
including baby and foam control variants.
€million €million € million Year on year change Year on year change
at current exchange rates at constant exchange rates
Continuing operations 2006 2005 2006 2005
at current rates of exchange 2006 2005 2004 vs 2005 vs 2004 vs 2005 vs 2004
Turnover 13 779 13 179 12 296 4.6% 7.2% 3.1% 3.4%
Operating profit 2178 1719 896 26.7% 91.9% 25.0% 83.6%
Operating margin 15.8% 13.0% 7.3%
Restructuring, business disposals,
impairment charges and one-time gain on US
healthcare plans included in operating margin 0.0% (3.4)% (9.2)%
2006 2005
Turnover and underlying sales growth vs 2005 vs 2004
Underlying sales growth (%) 3.7 4.1
Effect of acquisitions (%) 0.1 0.0
Effect of disposals (%) (0.7) (0.7)
Effect of exchange rates (%) 1.4 3.6
Turnover growth (%) 4.6 7.2
Turnover (€ million)
Continuing operations
The Americas
Operating margin (%)
Continuing operations
15.8
13.0
7.3
13 779
13 179
12 296
2006
2005
2004
2006
2005
2004
Operating profit (€ million)
Continuing operations
2 178
1 719
896
2006
2005
2004


