Unilever 2002 Annual Report Download - page 8
Download and view the complete annual report
Please find page 8 of the 2002 Unilever annual report below. You can navigate through the pages in the report by either clicking on the pages listed below, or by using the keyword search tool below to find specific information within the annual report.-
 1
1 -
 2
2 -
 3
3 -
 4
4 -
 5
5 -
 6
6 -
 7
7 -
 8
8 -
 9
9 -
 10
10 -
 11
11 -
 12
12 -
 13
13 -
 14
14 -
 15
15 -
 16
16 -
 17
17 -
 18
18 -
 19
19 -
20
-
21
-
22
-
23
-
24
-
25
-
26
-
27
-
28
-
29
-
30
-
31
-
32
-
33
-
34
-
35
-
36
-
37
-
38
-
39
-
40
-
41
-
42
-
43
-
44
-
45
-
46
-
47
-
48
-
49
-
50
-
51
-
52
-
53
-
54
-
55
-
56
-
57
-
58
-
59
-
60
-
61
-
62
-
63
-
64
-
65
-
66
-
67
-
68
-
69
-
70
-
71
-
72
-
73
-
74
-
75
-
76
-
77
-
78
-
79
-
80
-
81
-
82
-
83
-
84
-
85
-
86
-
87
-
88
-
89
-
90
-
91
-
92
-
93
-
94
-
95
-
96
-
97
-
98
-
99
-
100
-
101
-
102
-
103
-
104
-
105
-
106
-
107
-
108
-
109
-
110
-
111
-
112
-
113
-
114
-
115
-
116
-
117
-
118
-
119
-
120
-
121
-
122
-
123
-
124
-
125
-
126
-
127
-
128
-
129
-
130
-
131
-
132
-
133
-
134
-
135
-
136
-
137
-
138
-
139
-
140
-
141
-
142
-
143
-
144
-
145
-
146
-
147
-
148
-
149
-
150
-
151
-
152
-
153
-
154
-
155
-
156
 |
 |

Unilever Annual Report & Accounts and Form 20-F 2002
Report of the Directors
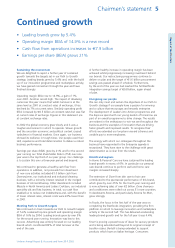
Sustaining the momentum
We are delighted to report a further year of sustained
growth towards the targets set in our Path to Growth
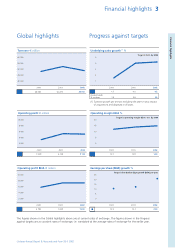
strategy. Leading brands grew by 5.4% and, with the build
up of our innovation programmes and marketplace activity,
we have gained momentum through the year and have
finished strongly.
Operating margin BEIA rose to 14.9%, a gain of 1%
over 2001. Another record high. The impact of devaluing
currencies this year means that whilst turnover is at the
same level as 2001 at constant rates of exchange, it has
declined by 7% at current rates. Similarly operating profit
BEIA increased by 0.5 billion at constant rates but was flat
at current rates of exchange. Figures in this statement are
at constant exchange rates.
In 2002 the global economy grew slowly and it was a
tougher environment in which to operate. Slower growth
and the uncertain economic and political context caused
turbulence in financial markets. Once again, our business
showed its resilience in tough times. Our people used their
skill, experience and total determination to deliver a robust
business performance.
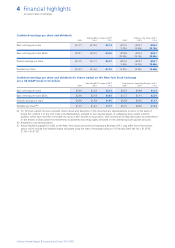
Earnings per share (BEIA) grew by 21% and for the second
year running our Total Shareholder Return (TSR) over one
year was in the top third of our peer group. Our challenge
is to sustain this over a three-year period and beyond.
We continued to generate a healthy cash flow from
operations. In addition, net proceeds from divestment
of non-core activities included 1.0 billion cash from
DiverseyLever, our institutional and industrial cleaning
business, with a minority interest retained in the merged
business of JohnsonDiversey. Other divestments included
Mazola in North America and Loders Croklaan, our industrial
speciality oils and fats business. In total, our cash flow
enabled us to reduce net indebtedness and, with the benefit
of lower interest rates, interest costs were 22% lower than
in 2001.
Meeting Path to Growth targets
We continued on track towards our Path to Growth targets
of 5-6% sustained top-line growth and operating margin
BEIA of 16% by 2004. Leading brands grew by over 5%
for the second year running. Innovation was key to this
success. Advertising was entirely focused on our leading
brands which constituted 89% of total turnover at the
end of the year.
A further healthy increase in operating margin has been
achieved whilst progressively increasing investment behind
our brands. Our restructuring programmes continue to
deliver on plan and the target of 1.6 billion procurement
savings was passed ahead of schedule. Furthermore,
by the end of the year we had reached the full Bestfoods
integration savings target of 0.8 billion, again ahead
of plan.
Energising our people
We can only meet and sustain the objectives of our Path to
Growth strategy if our people have a passion for winning
and a culture that encourages and rewards enterprise.
The development of Leaders into Action programmes and
the days we spend with our young leaders of tomorrow are
part of an overall programme to drive change. The results
are evident in the enthusiasm to win we see throughout the
business and the examples of innovation that are driving
faster growth and improved results. To recognise their
efforts we extended our long-term reward schemes and
variable pay to more employees.
The energy with which our colleagues throughout the
business have responded to the Enterprise agenda is
exceptional. They have risen to the challenge with great
determination as is clear from the results.
Brands and regions
In Home & Personal Care we have sustained the leading
brand growth in excess of 6%. In particular our personal
care brands continue to perform well and home care
margins increased sharply.
The extension of Dove from skin care to hair care
contributed to the spectacular performance of this brand,
which grew by over 25% for the fourth year running and
is now achieving sales of over 2 billion. Dove shampoo
and conditioners were rolled out across 31 more countries.
In deodorants Rexona, and particularly Rexona for Men,
grew strongly.
In Foods, the focus in the first half of the year was on
completing the Bestfoods integration, providing the firm
platform on which to leverage innovation and marketplace
activity in the second half. This has delivered accelerating
leading brand growth and for the full year it was 4.4%.
Knorr is proving a powerhouse of ideas for savoury products
and is being extended well beyond its original concept of
bouillon cubes. Bertolli is being extended to support
products which have an Italian heritage. Consumers
•Leading brands grow by 5.4%
•Operating margin BEIA of 14.9% is a new record
•Cash flow from operations increases to 7.9 billion
•Earnings per share (BEIA) grows 21%
Continued growth
Chairmen’s statement 5