Unilever 2002 Annual Report Download - page 6
Download and view the complete annual report
Please find page 6 of the 2002 Unilever annual report below. You can navigate through the pages in the report by either clicking on the pages listed below, or by using the keyword search tool below to find specific information within the annual report.-
 1
1 -
 2
2 -
 3
3 -
 4
4 -
 5
5 -
 6
6 -
 7
7 -
 8
8 -
 9
9 -
 10
10 -
 11
11 -
 12
12 -
 13
13 -
 14
14 -
 15
15 -
 16
16 -
 17
17 -
18
-
19
-
20
-
21
-
22
-
23
-
24
-
25
-
26
-
27
-
28
-
29
-
30
-
31
-
32
-
33
-
34
-
35
-
36
-
37
-
38
-
39
-
40
-
41
-
42
-
43
-
44
-
45
-
46
-
47
-
48
-
49
-
50
-
51
-
52
-
53
-
54
-
55
-
56
-
57
-
58
-
59
-
60
-
61
-
62
-
63
-
64
-
65
-
66
-
67
-
68
-
69
-
70
-
71
-
72
-
73
-
74
-
75
-
76
-
77
-
78
-
79
-
80
-
81
-
82
-
83
-
84
-
85
-
86
-
87
-
88
-
89
-
90
-
91
-
92
-
93
-
94
-
95
-
96
-
97
-
98
-
99
-
100
-
101
-
102
-
103
-
104
-
105
-
106
-
107
-
108
-
109
-
110
-
111
-
112
-
113
-
114
-
115
-
116
-
117
-
118
-
119
-
120
-
121
-
122
-
123
-
124
-
125
-
126
-
127
-
128
-
129
-
130
-
131
-
132
-
133
-
134
-
135
-
136
-
137
-
138
-
139
-
140
-
141
-
142
-
143
-
144
-
145
-
146
-
147
-
148
-
149
-
150
-
151
-
152
-
153
-
154
-
155
-
156
 |
 |

Unilever Annual Report & Accounts and Form 20-F 2002
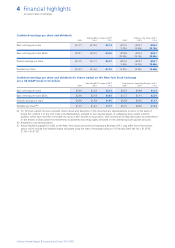
Financial highlights 3
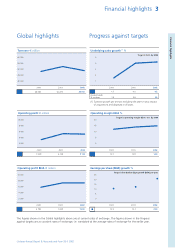
Financial highlights
40 000
60 000
55 000
50 000
45 000
20022000 2001
48 76048 066 52 206
Turnover million
Underlying sales growth(1) %
2002
2000 2001
4.2
89
1.5
78
4.0
84
Leading brands
% turnover
(1) Turnover growth per annum excluding the year-on-year impact
of acquisitions and disposals in all years.
1
3
4
2
5
Target is 5-6% by 2004
2 000
10 000
6 000
8 000
4 000
20022000 2001
5 1253 238 5 258
Operating profit million
0
20
10
15
5
20022000 2001
14.912.0 13.9
Operating margin BEIA %
Target is operating margin BEIA >16% by 2004
2 000
10 000
8 000
6 000
4 000
20022000 2001
7 2605 794 7 269
Operating profit BEIA million
0
25
20
10
15
5
20022000 2001
20.910.5 12.2
Earnings per share (BEIA) growth %
Target is low double digit growth (BEIA) per year
Global highlights Progress against targets
The figures shown in the Global highlights above are at current rates of exchange. The figures shown in the Progress
against targets are at constant rates of exchange, i.e. translated at the average rates of exchange for the earlier year.