Ulta 2015 Annual Report Download - page 70
Download and view the complete annual report
Please find page 70 of the 2015 Ulta annual report below. You can navigate through the pages in the report by either clicking on the pages listed below, or by using the keyword search tool below to find specific information within the annual report.-
 1
1 -
2
-
3
-
4
-
5
-
6
-
7
-
8
-
9
-
10
-
11
-
12
-
13
-
14
-
15
-
16
-
17
-
18
-
19
-
20
-
21
-
22
-
23
-
24
-
25
-
26
-
27
-
28
-
29
-
30
-
31
-
32
-
33
-
34
-
35
-
36
-
37
-
38
-
39
-
40
-
41
-
42
-
43
-
44
-
45
-
46
-
47
-
48
-
49
-
50
-
51
-
52
-
53
-
54
-
55
-
56
-
57
-
58
-
59
-
 60
60 -
 61
61 -
 62
62 -
 63
63 -
 64
64 -
 65
65 -
 66
66 -
 67
67 -
 68
68 -
 69
69 -
 70
70 -
 71
71 -
 72
72 -
 73
73 -
 74
74 -
 75
75 -
 76
76 -
 77
77 -
 78
78 -
 79
79 -
 80
80 -
81
-
82
-
83
-
84
 |
 |

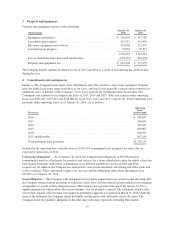
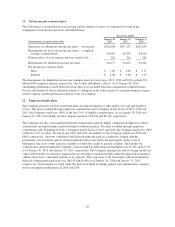
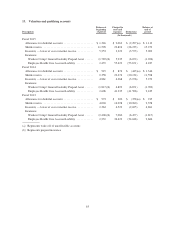
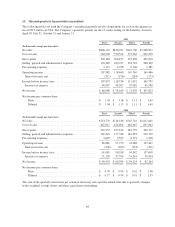
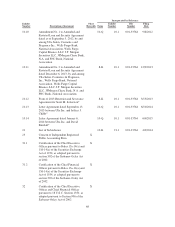
14. Selected quarterly financial data (unaudited)
The following tables set forth the Company’s unaudited quarterly results of operations for each of the quarters in
fiscal 2015 and fiscal 2014. The Company’s quarterly periods are the 13 weeks ending on the Saturday closest to
April 30, July 31, October 31 and January 31.
2015
First Second Third Fourth
(In thousands, except per share data)
Net sales . . . . . . . . . . . . . . . . . . . . . . . . . . . . . . . . . . . . . . . . . . . . $868,122 $876,999 $910,700 $1,268,295
Cost of sales . . . . . . . . . . . . . . . . . . . . . . . . . . . . . . . . . . . . . . . . . 564,938 570,524 575,062 829,259
Grossprofit.......................................... 303,184 306,475 335,638 439,036
Selling, general and administrative expenses . . . . . . . . . . . . . . . . 192,485 183,937 218,763 268,169
Pre-opening expenses . . . . . . . . . . . . . . . . . . . . . . . . . . . . . . . . . . 3,117 4,078 6,106 1,381
Operating income . . . . . . . . . . . . . . . . . . . . . . . . . . . . . . . . . . . . . 107,582 118,460 110,769 169,486
Interest income, net . . . . . . . . . . . . . . . . . . . . . . . . . . . . . . . . . (311) (276) (283) (273)
Income before income taxes . . . . . . . . . . . . . . . . . . . . . . . . . . . . . 107,893 118,736 111,052 169,759
Income tax expense . . . . . . . . . . . . . . . . . . . . . . . . . . . . . . . . . 40,947 44,567 39,982 61,936
Netincome .......................................... $ 66,946 $ 74,169 $ 71,070 $ 107,823
Net income per common share:
Basic ........................................... $ 1.04 $ 1.16 $ 1.11 $ 1.69
Diluted ......................................... $ 1.04 $ 1.15 $ 1.11 $ 1.69
2014
First Second Third Fourth
(In thousands, except per share data)
Net sales . . . . . . . . . . . . . . . . . . . . . . . . . . . . . . . . . . . . . . . . . . . . $713,770 $734,236 $745,722 $1,047,641
Cost of sales . . . . . . . . . . . . . . . . . . . . . . . . . . . . . . . . . . . . . . . . . 467,817 474,894 463,967 697,904
Grossprofit.......................................... 245,953 259,342 281,755 349,737
Selling, general and administrative expenses . . . . . . . . . . . . . . . . 162,443 157,768 181,093 210,702
Pre-opening expenses . . . . . . . . . . . . . . . . . . . . . . . . . . . . . . . . . . 2,629 3,595 6,574 1,568
Operating income . . . . . . . . . . . . . . . . . . . . . . . . . . . . . . . . . . . . . 80,881 97,979 94,088 137,467
Interest income, net . . . . . . . . . . . . . . . . . . . . . . . . . . . . . . . . . (200) (209) (254) (231)
Income before income taxes . . . . . . . . . . . . . . . . . . . . . . . . . . . . . 81,081 98,188 94,342 137,698
Income tax expense . . . . . . . . . . . . . . . . . . . . . . . . . . . . . . . . . 31,128 37,394 35,218 50,434
Netincome .......................................... $ 49,953 $ 60,794 $ 59,124 $ 87,264
Net income per common share:
Basic ........................................... $ 0.78 $ 0.94 $ 0.92 $ 1.36
Diluted ......................................... $ 0.77 $ 0.94 $ 0.91 $ 1.35
The sum of the quarterly net income per common share may not equal the annual total due to quarterly changes
in the weighted average shares and share equivalents outstanding.
64