Ulta 2015 Annual Report Download - page 40
Download and view the complete annual report
Please find page 40 of the 2015 Ulta annual report below. You can navigate through the pages in the report by either clicking on the pages listed below, or by using the keyword search tool below to find specific information within the annual report.-
 1
1 -
2
-
3
-
4
-
5
-
6
-
7
-
8
-
9
-
10
-
11
-
12
-
13
-
14
-
15
-
16
-
17
-
18
-
19
-
20
-
21
-
22
-
23
-
24
-
25
-
26
-
27
-
28
-
29
-
 30
30 -
 31
31 -
 32
32 -
 33
33 -
 34
34 -
 35
35 -
 36
36 -
 37
37 -
 38
38 -
 39
39 -
 40
40 -
 41
41 -
 42
42 -
 43
43 -
 44
44 -
 45
45 -
 46
46 -
 47
47 -
 48
48 -
 49
49 -
 50
50 -
51
-
52
-
53
-
54
-
55
-
56
-
57
-
58
-
59
-
60
-
61
-
62
-
63
-
64
-
65
-
66
-
67
-
68
-
69
-
70
-
71
-
72
-
73
-
74
-
75
-
76
-
77
-
78
-
79
-
80
-
81
-
82
-
83
-
84
 |
 |

Liquidity and capital resources
Our primary cash needs are for capital expenditures for new, relocated and remodeled stores, increased
merchandise inventories related to store expansion and new brand additions, supply chain improvements, share
repurchases and for continued improvement in our information technology systems.
Our primary sources of liquidity are cash on hand, short-term investments and cash flows from operations,
including changes in working capital, and borrowings under our credit facility. The most significant component
of our working capital is merchandise inventories reduced by related accounts payable and accrued expenses.
Our working capital needs are greatest from August through November each year as a result of our inventory
build-up during this period for the approaching holiday season. This is also the time of year when we are at
maximum investment levels in our new store class and may not have collected all of the landlord allowances due
to us as part of our lease agreements. Based on past performance and current expectations, we believe that cash
on hand, short-term investments, cash generated from operations and borrowings under the credit facility will
satisfy the Company’s working capital needs, capital expenditure needs, commitments and other liquidity
requirements through at least the next 12 months.
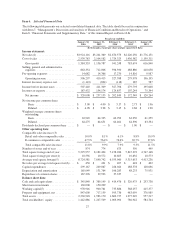
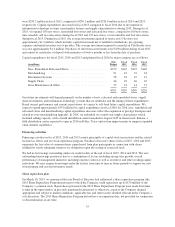
The following table presents a summary of our cash flows for fiscal years 2015, 2014 and 2013:
Fiscal year ended
(In thousands)
January 30,
2016
January 31,
2015
February 1,
2014
Net cash provided by operating activities . . . . . . . . . . . . . . . . $ 375,874 $ 396,592 $ 327,725
Net cash used in investing activities . . . . . . . . . . . . . . . . . . . . (278,958) (399,276) (226,024)
Net cash used in financing activities . . . . . . . . . . . . . . . . . . . . (140,225) (27,643) (2,700)
Net (decrease) increase in cash and cash equivalents . . . . . . . $ (43,309) $ (30,327) $ 99,001
Operating activities
Operating activities consist of net income adjusted for certain non-cash items, including depreciation and
amortization, non-cash stock-based compensation, realized gains or losses on disposal of property and equipment
and the effect of working capital changes.
Merchandise inventories were $761.8 million at January 30, 2016, compared to $581.2 million at January 31,
2015, representing an increase of $180.6 million or 31.1%. Average inventory per store increased 16.1%
compared to prior year. The increase in inventory is primarily due to the following:
‰approximately $75 million due to the addition of 100 net new stores opened since January 31, 2015;
‰approximately $62 million due to increased sales, new brand additions and incremental inventory for in-
store prestige brand boutiques; and
‰approximately $43 million due to the opening of the Company’s fourth distribution center in Greenwood,
Indiana.
We had a current tax liability of $12.7 million at the end of fiscal 2015 compared to $19.4 million at the end of
fiscal 2014. The decrease in taxes payable is primarily due to an increase in tax deductible stock option exercises
and a decrease in state taxes.
Deferred rent liabilities were $321.8 million at January 30, 2016, an increase of $27.7 million compared to
$294.1 million at January 31, 2015. Deferred rent includes deferred construction allowances, future rental
increases and rent holidays which are all recognized on a straight-line basis over their respective lease term. The
increase is primarily due to the addition of 100 net new stores opened since January 31, 2015.
Investing activities
We have historically used cash primarily for new and remodeled stores, supply chain investments, short-term
investments and investments in information technology systems. Investment activities for capital expenditures
34